29
/
en
AIzaSyAYiBZKx7MnpbEhh9jyipgxe19OcubqV5w
April 1, 2024
230963
Rwanda
RWA
true
2
1
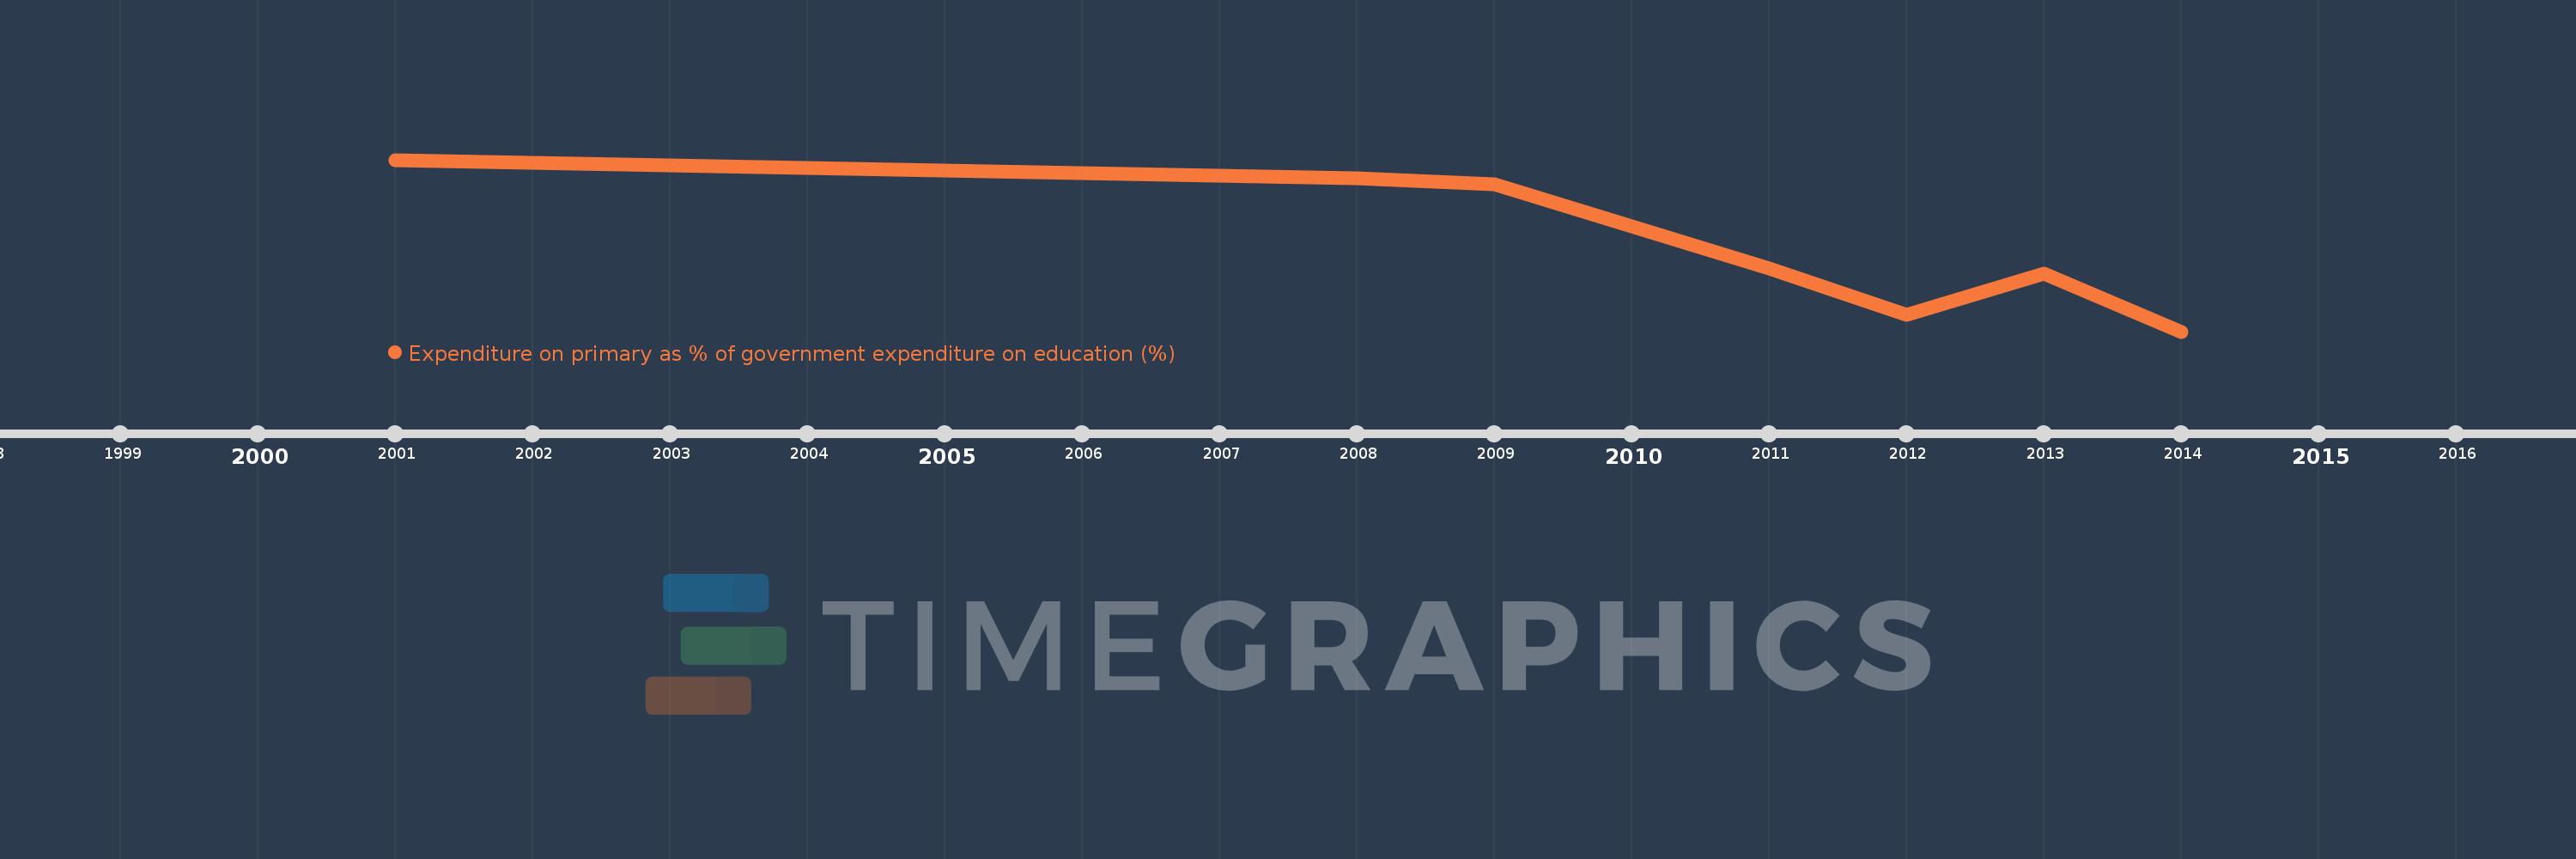
Expenditure on primary as % of government expenditure on education (%)
2014,2013,2012,2011,2009,2008,2001
This statistics in other country:
Timeline:
This timeline shows a graph from 2001 to 2014 of Rwanda. No data until 2000. Number of actual observations by date: 7.
Source name:
World Development Indicators
Source organization:
UNESCO Institute for Statistics
Categories, topics:
Education
Last updated:
apr 23, 2017
Indicators value changes by year
Maximum:
48.178
jan 1, 2001
At the date of observation
Value
Absolute change
Change from previous value
jan 1, 2001
48.178
+48.178
0.0%
jan 1, 2008
46.267
-1.911
-3.97%
jan 1, 2009
45.595
-0.672
-1.45%
jan 1, 2011
36.737
-8.858
-19.43%
jan 1, 2012
31.846
-4.891
-13.31%
jan 1, 2013
36.249
+4.403
13.82%
jan 1, 2014
30.11
-6.139
-16.93%
Ranking of countries by current statistics by years


Comments: