29
/
en
AIzaSyAYiBZKx7MnpbEhh9jyipgxe19OcubqV5w
April 1, 2024
250705
St. Lucia
LCA
true
2
1
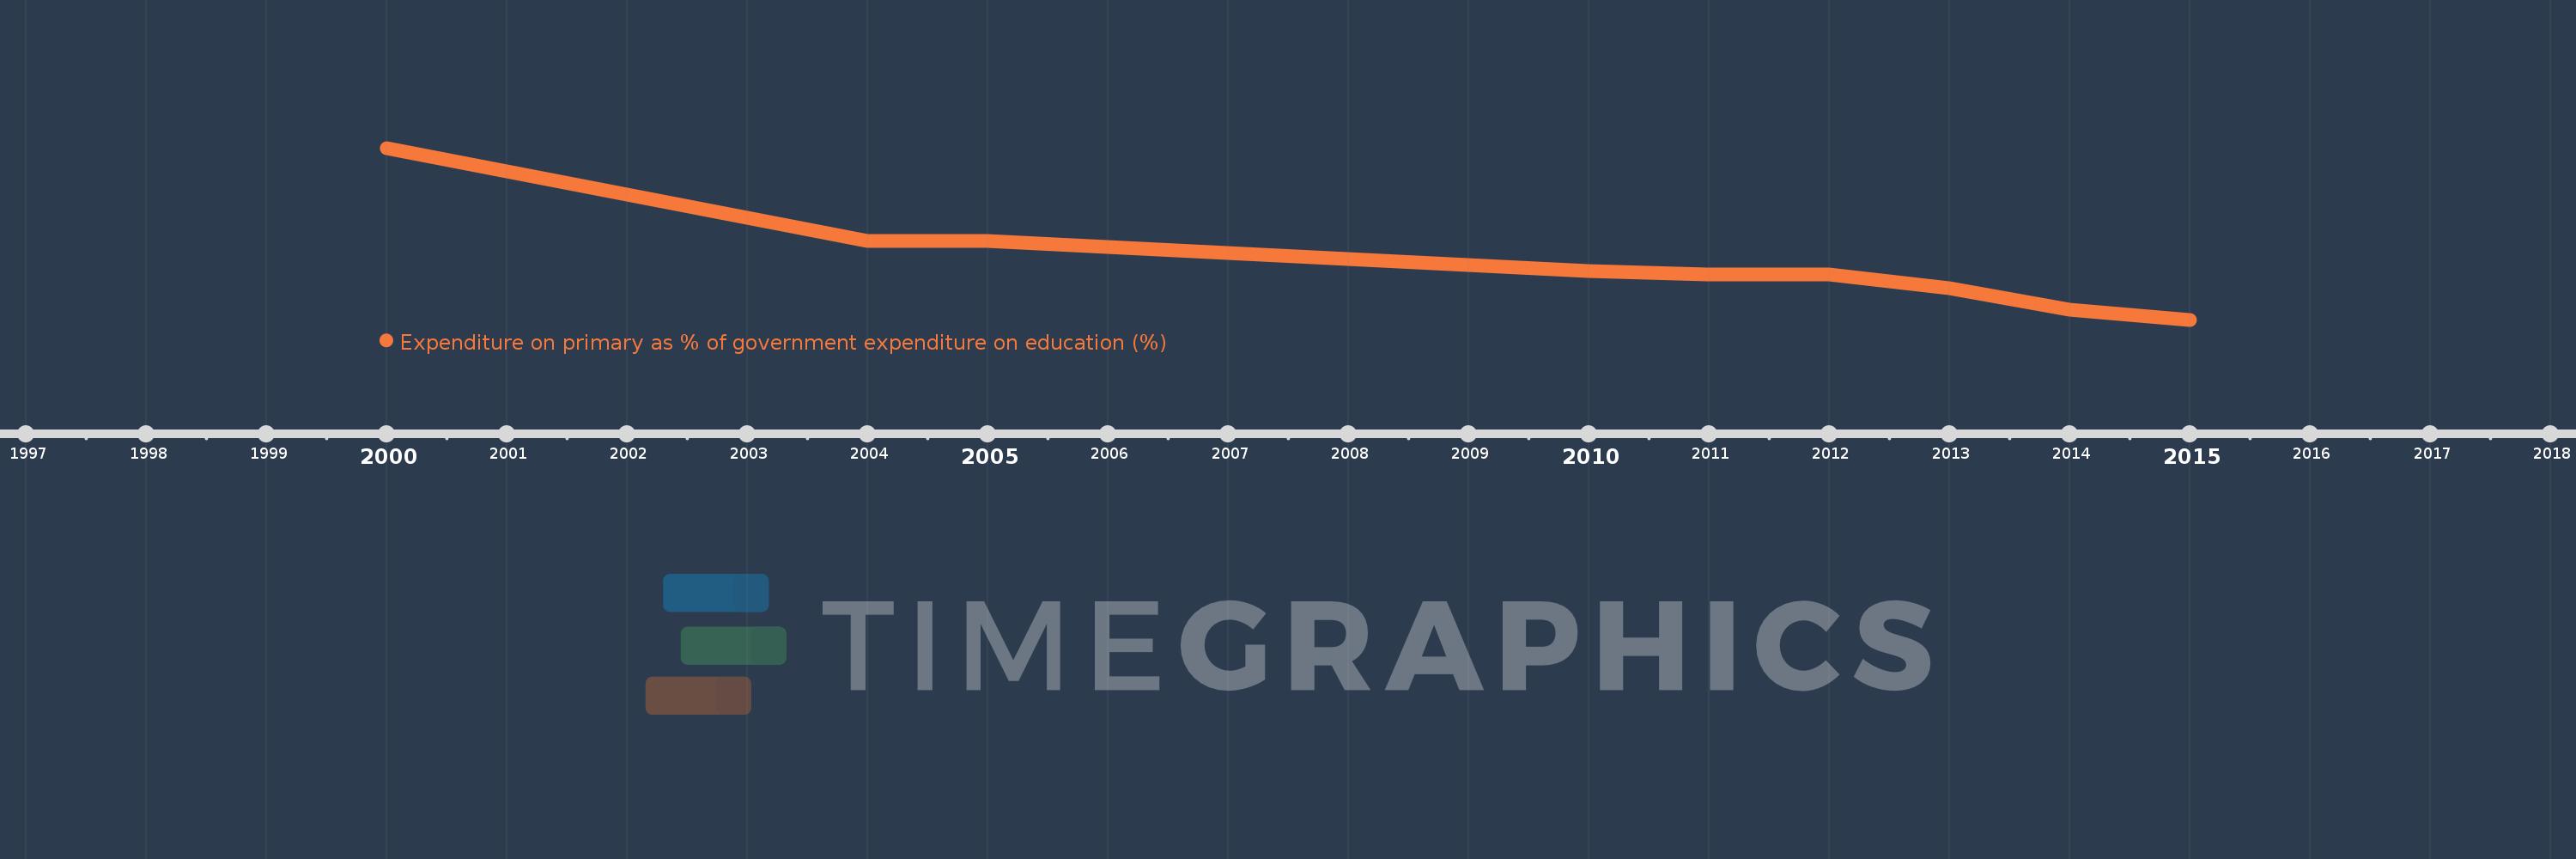
Expenditure on primary as % of government expenditure on education (%)
2015,2014,2013,2012,2011,2010,2005,2004,2000
This statistics in other country:
Timeline:
This timeline shows a graph from 2000 to 2015 of St. Lucia. No data until 1999. Number of actual observations by date: 9.
Source name:
World Development Indicators
Source organization:
UNESCO Institute for Statistics
Categories, topics:
Education
Last updated:
apr 23, 2017
Indicators value changes by year
Minimum:
35.544
jan 1, 2015
Maximum:
61.062
jan 1, 2000
At the date of observation
Value
Absolute change
Change from previous value
jan 1, 2000
61.062
+61.062
0.0%
jan 1, 2004
47.214
-13.849
-22.68%
jan 1, 2005
47.214
0.0
0.0%
jan 1, 2010
42.783
-4.431
-9.38%
jan 1, 2011
42.279
-0.504
-1.18%
jan 1, 2012
42.305
+0.026
0.06%
jan 1, 2013
40.27
-2.034
-4.81%
jan 1, 2014
37.077
-3.193
-7.93%
jan 1, 2015
35.544
-1.533
-4.13%
Ranking of countries by current statistics by years


Comments: