29
/
en
AIzaSyAYiBZKx7MnpbEhh9jyipgxe19OcubqV5w
April 1, 2024
94783
Burkina Faso
BFA
true
2
1
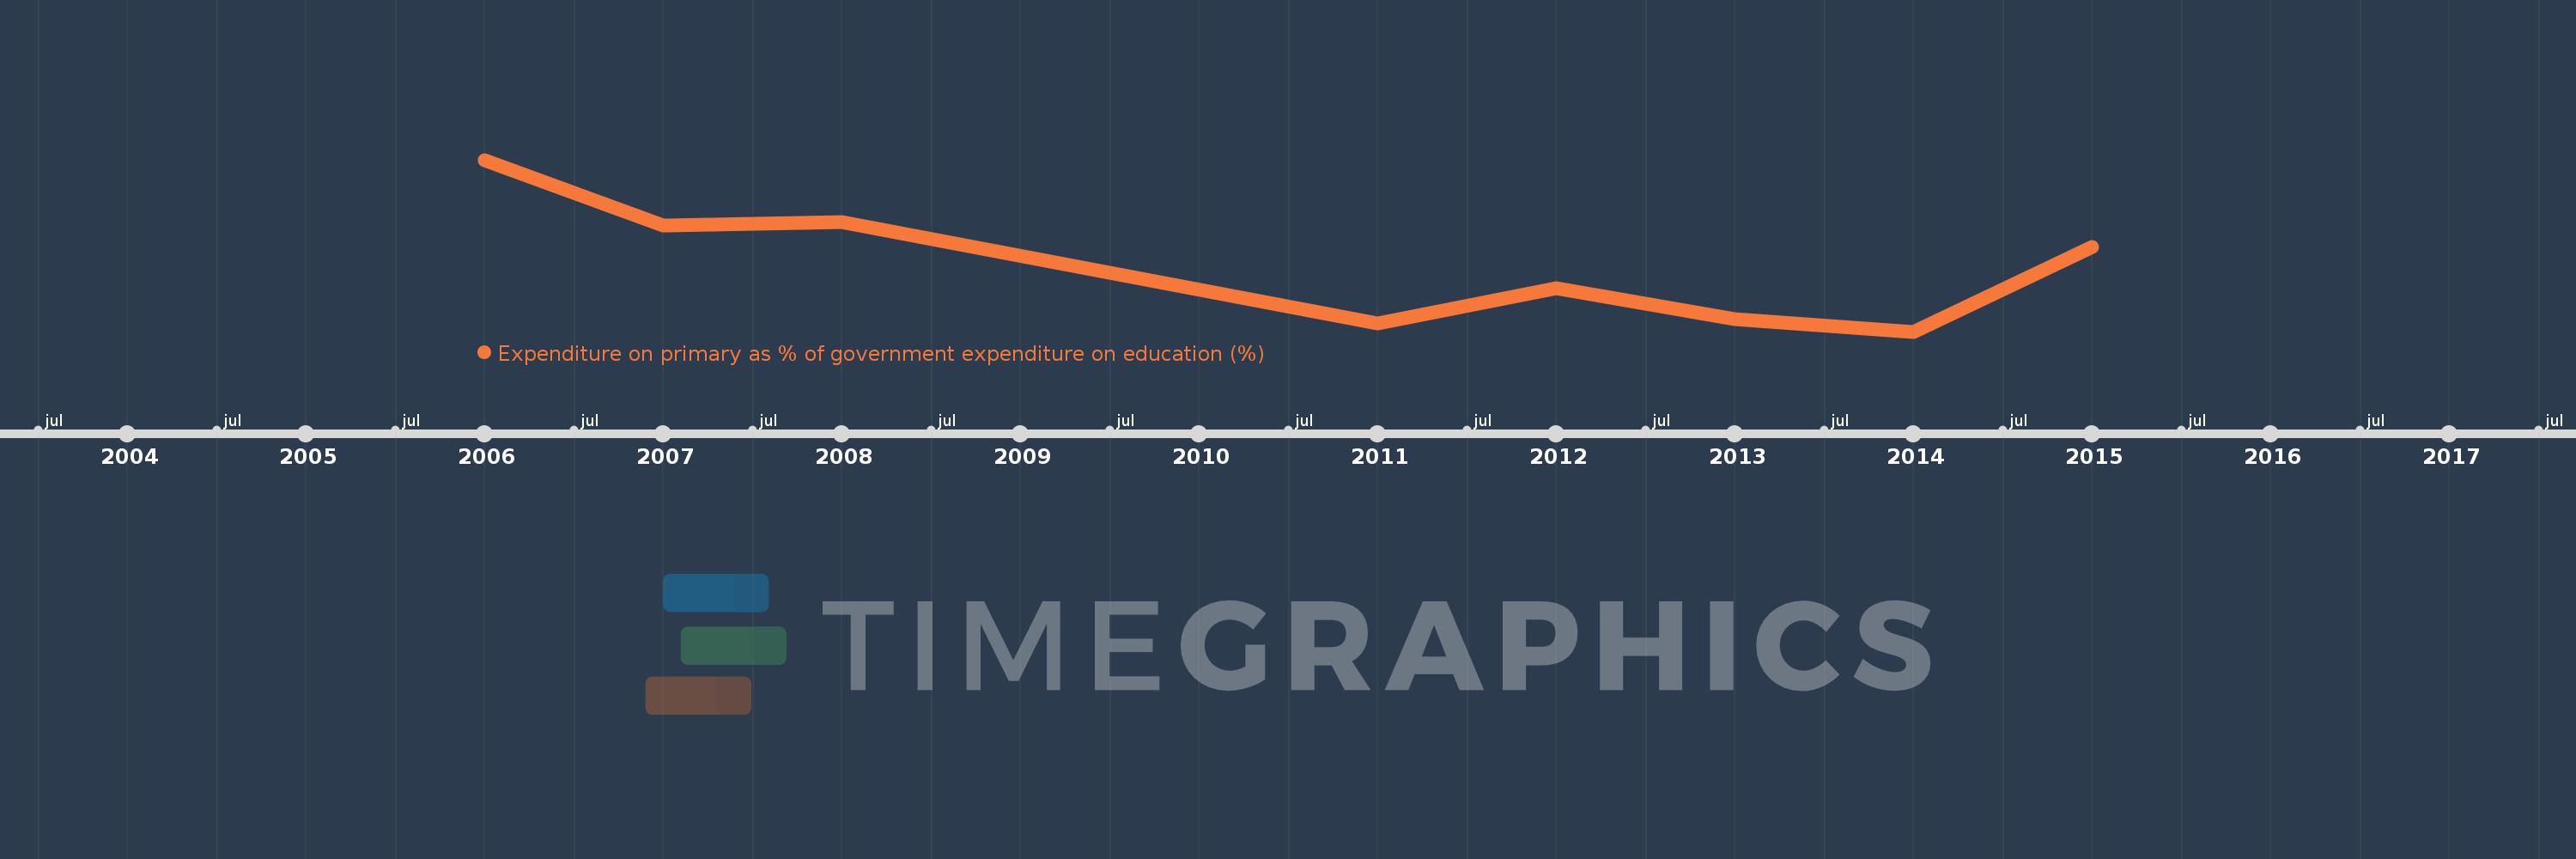
Expenditure on primary as % of government expenditure on education (%)
2015,2014,2013,2012,2011,2008,2007,2006
This statistics in other country:
Timeline:
This timeline shows a graph from 2006 to 2015 of Burkina Faso. No data until 2005. Number of actual observations by date: 8.
Source name:
World Development Indicators
Source organization:
UNESCO Institute for Statistics
Categories, topics:
Education
Last updated:
apr 23, 2017
Indicators value changes by year
Minimum:
59.788
jan 1, 2014
Maximum:
71.181
jan 1, 2006
At the date of observation
Value
Absolute change
Change from previous value
jan 1, 2006
71.181
+71.181
0.0%
jan 1, 2007
66.811
-4.37
-6.14%
jan 1, 2008
67.034
+0.223
0.33%
jan 1, 2011
60.341
-6.693
-9.98%
jan 1, 2012
62.641
+2.3
3.81%
jan 1, 2013
60.627
-2.015
-3.22%
jan 1, 2014
59.788
-0.839
-1.38%
jan 1, 2015
65.41
+5.622
9.4%
Ranking of countries by current statistics by years


Comments: