29
/
en
AIzaSyAYiBZKx7MnpbEhh9jyipgxe19OcubqV5w
April 1, 2024
272160
Uganda
UGA
true
2
1
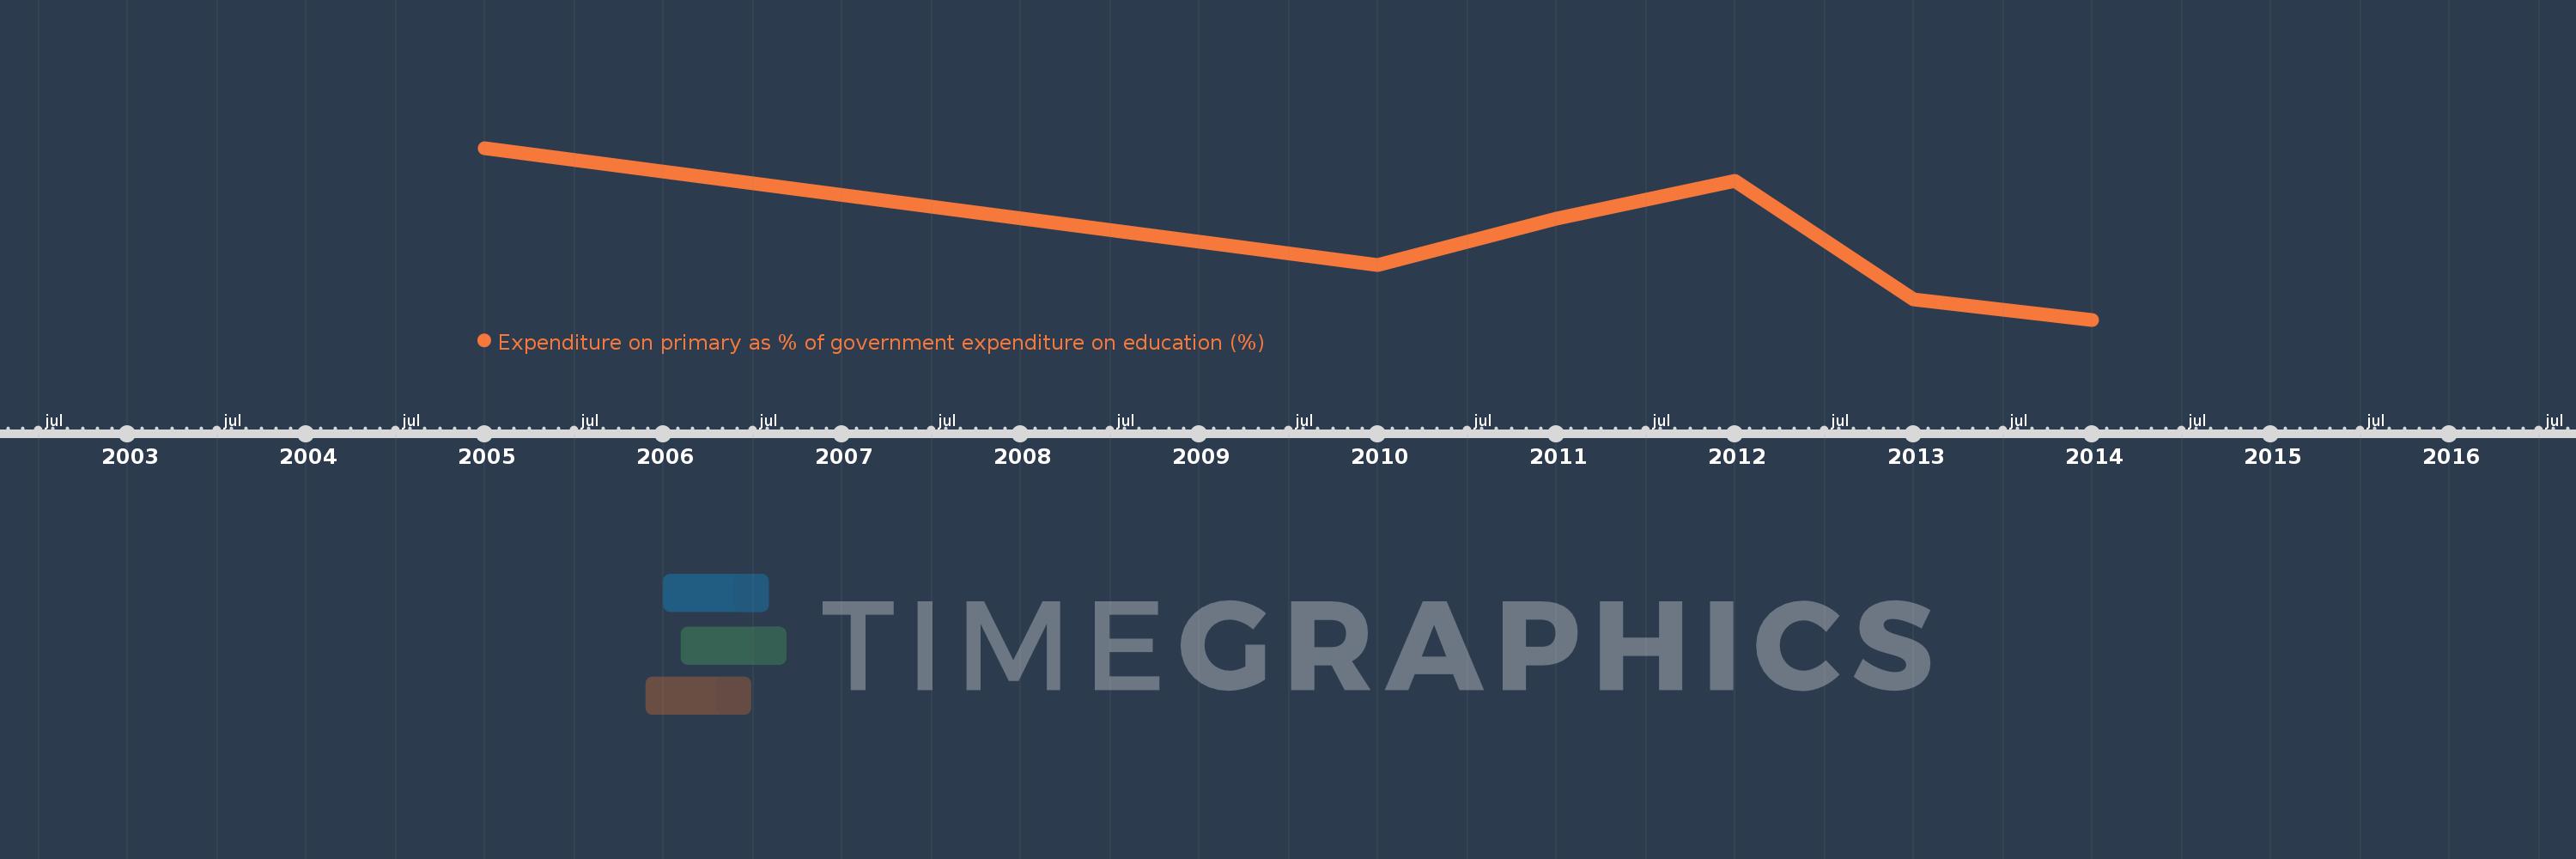
Expenditure on primary as % of government expenditure on education (%)
2014,2013,2012,2011,2010,2005
This statistics in other country:
Timeline:
This timeline shows a graph from 2005 to 2014 of Uganda. No data until 2004. Number of actual observations by date: 6.
Source name:
World Development Indicators
Source organization:
UNESCO Institute for Statistics
Categories, topics:
Education
Last updated:
apr 23, 2017
Indicators value changes by year
Minimum:
52.663
jan 1, 2014
At the date of observation
Value
Absolute change
Change from previous value
jan 1, 2005
61.21
+61.21
0.0%
jan 1, 2010
55.375
-5.835
-9.53%
jan 1, 2011
57.701
+2.326
4.2%
jan 1, 2012
59.552
+1.851
3.21%
jan 1, 2013
53.669
-5.883
-9.88%
jan 1, 2014
52.663
-1.006
-1.87%
Ranking of countries by current statistics by years


Comments: