29
/
en
AIzaSyAYiBZKx7MnpbEhh9jyipgxe19OcubqV5w
April 1, 2024
133080
Finland
FIN
true
2
1
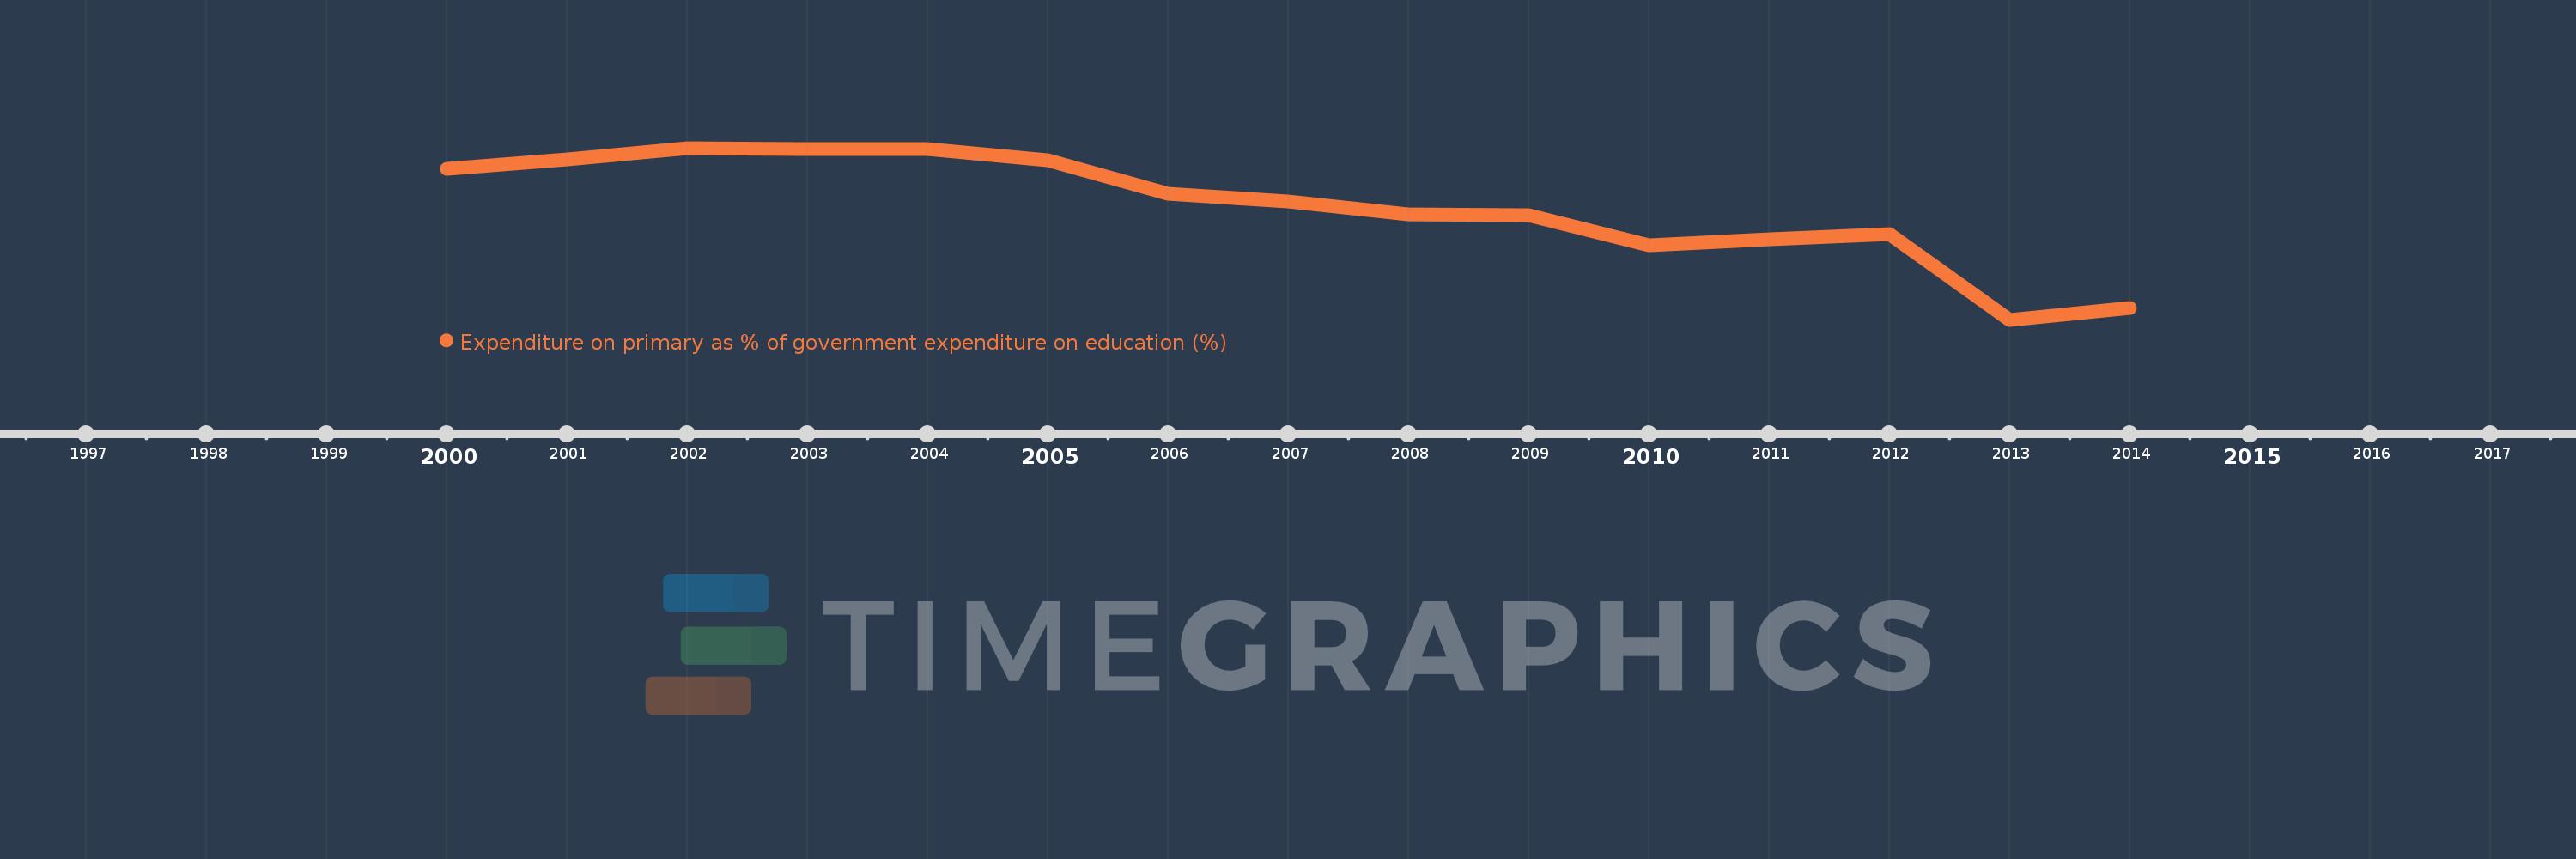
Expenditure on primary as % of government expenditure on education (%)
2014,2013,2012,2011,2010,2009,2008,2007,2006,2005,2004,2003,2002,2001,2000
This statistics in other country:
Timeline:
This timeline shows a graph from 2000 to 2014 of Finland. No data until 1999. Number of actual observations by date: 15.
Source name:
World Development Indicators
Source organization:
UNESCO Institute for Statistics
Categories, topics:
Education
Last updated:
apr 23, 2017
Indicators value changes by year
Minimum:
18.398
jan 1, 2013
Maximum:
21.624
jan 1, 2002
At the date of observation
Value
Absolute change
Change from previous value
jan 1, 2000
21.228
+21.228
0.0%
jan 1, 2001
21.402
+0.174
0.82%
jan 1, 2002
21.624
+0.222
1.04%
jan 1, 2003
21.599
-0.025
-0.12%
jan 1, 2004
21.601
+0.002
0.01%
jan 1, 2005
21.389
-0.213
-0.99%
jan 1, 2006
20.76
-0.629
-2.94%
jan 1, 2007
20.62
-0.14
-0.67%
jan 1, 2008
20.375
-0.245
-1.19%
jan 1, 2009
20.367
-0.008
-0.04%
jan 1, 2010
19.793
-0.575
-2.82%
jan 1, 2011
19.907
+0.114
0.58%
jan 1, 2012
20.011
+0.104
0.52%
jan 1, 2013
18.398
-1.613
-8.06%
jan 1, 2014
18.616
+0.218
1.19%
Ranking of countries by current statistics by years


Comments: