29
/
en
AIzaSyAYiBZKx7MnpbEhh9jyipgxe19OcubqV5w
April 1, 2024
214247
Norway
NOR
true
2
1
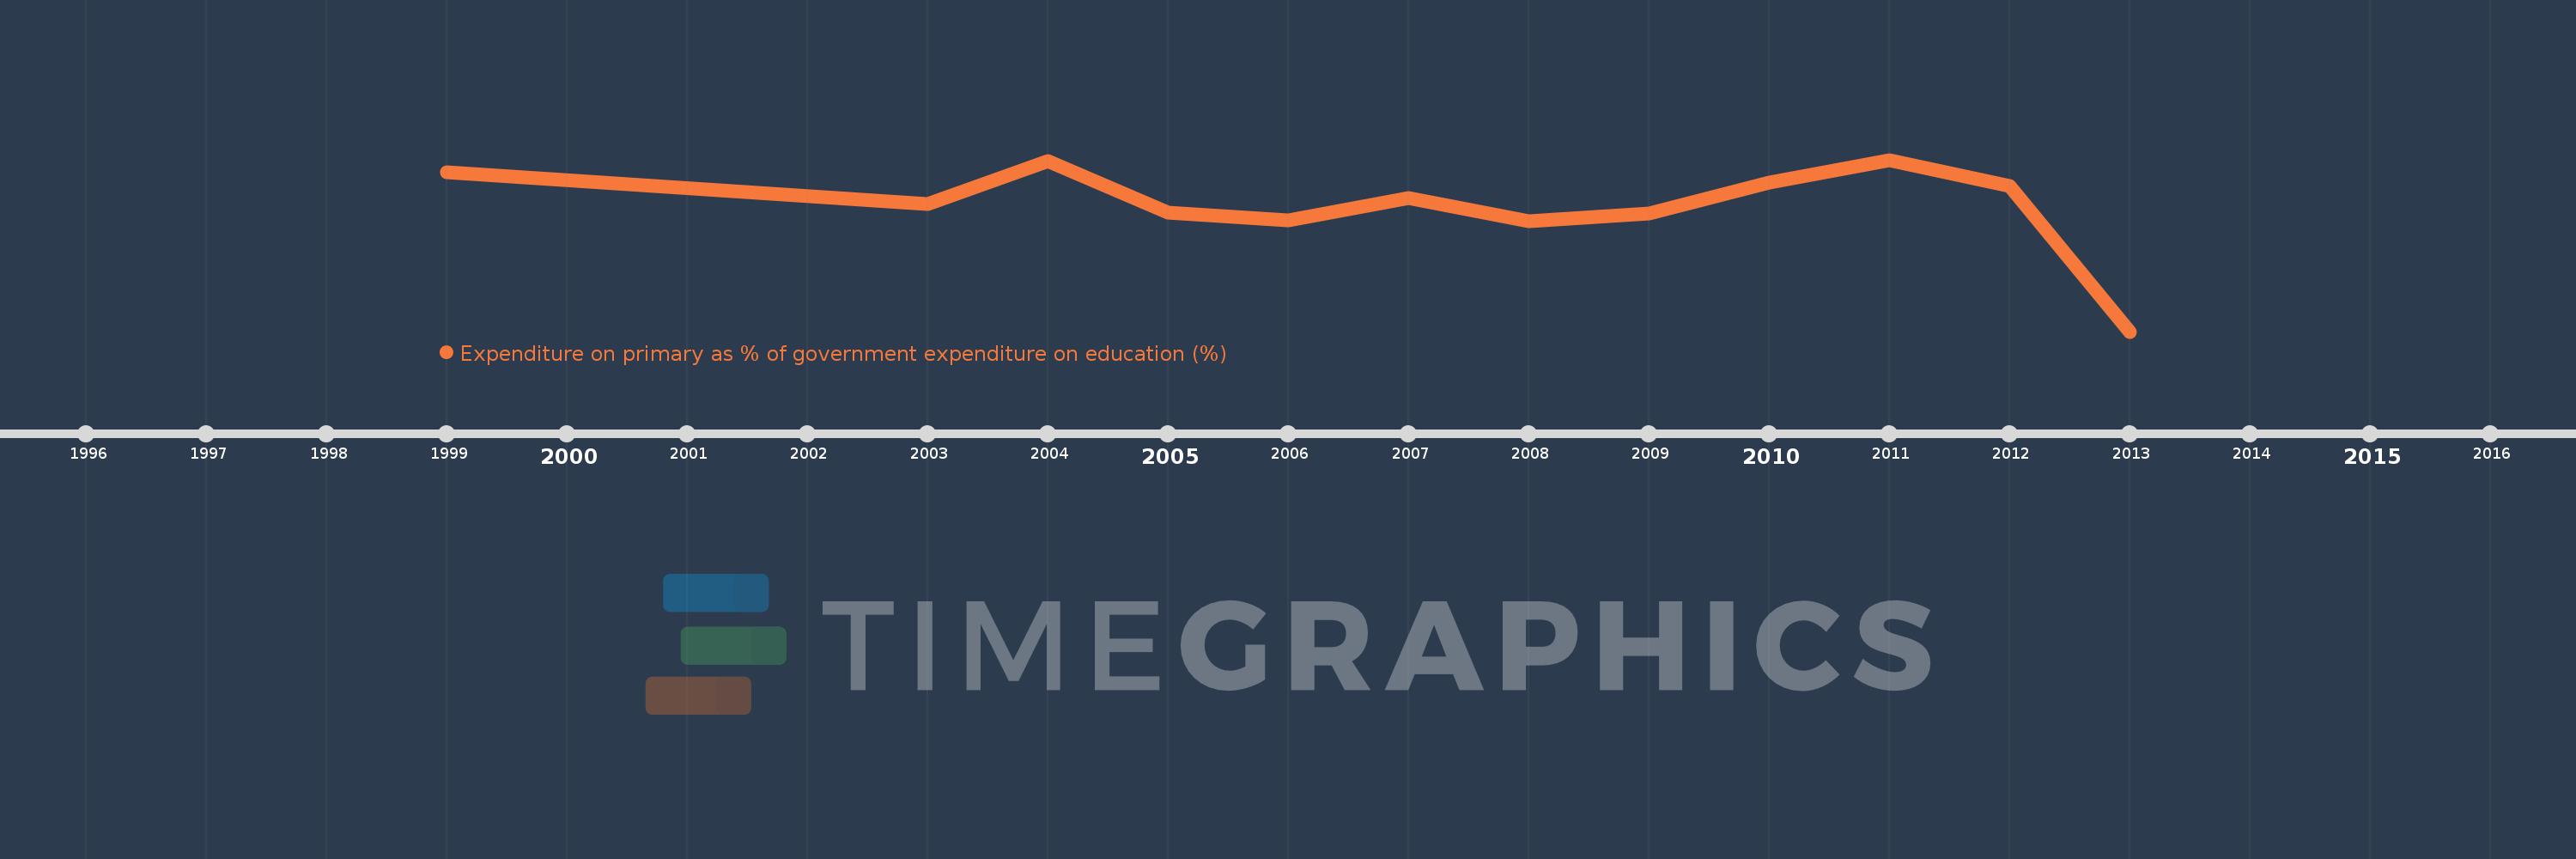
Expenditure on primary as % of government expenditure on education (%)
2013,2012,2011,2010,2009,2008,2007,2006,2005,2004,2003,1999
This statistics in other country:
Timeline:
This timeline shows a graph from 1999 to 2013 of Norway. No data until 1998. Number of actual observations by date: 12.
Source name:
World Development Indicators
Source organization:
UNESCO Institute for Statistics
Categories, topics:
Education
Last updated:
apr 23, 2017
Indicators value changes by year
Minimum:
22.032
jan 1, 2013
Maximum:
26.666
jan 1, 2011
At the date of observation
Value
Absolute change
Change from previous value
jan 1, 1999
26.338
+26.338
0.0%
jan 1, 2003
25.469
-0.869
-3.3%
jan 1, 2004
26.631
+1.162
4.56%
jan 1, 2005
25.25
-1.381
-5.19%
jan 1, 2006
25.024
-0.226
-0.89%
jan 1, 2007
25.64
+0.616
2.46%
jan 1, 2008
25.002
-0.637
-2.49%
jan 1, 2009
25.211
+0.208
0.83%
jan 1, 2010
26.056
+0.845
3.35%
jan 1, 2011
26.666
+0.611
2.34%
jan 1, 2012
25.956
-0.711
-2.67%
jan 1, 2013
22.032
-3.924
-15.12%
Ranking of countries by current statistics by years


Comments: