29
/
en
AIzaSyAYiBZKx7MnpbEhh9jyipgxe19OcubqV5w
April 1, 2024
52559
OECD members
OED
false
2
1
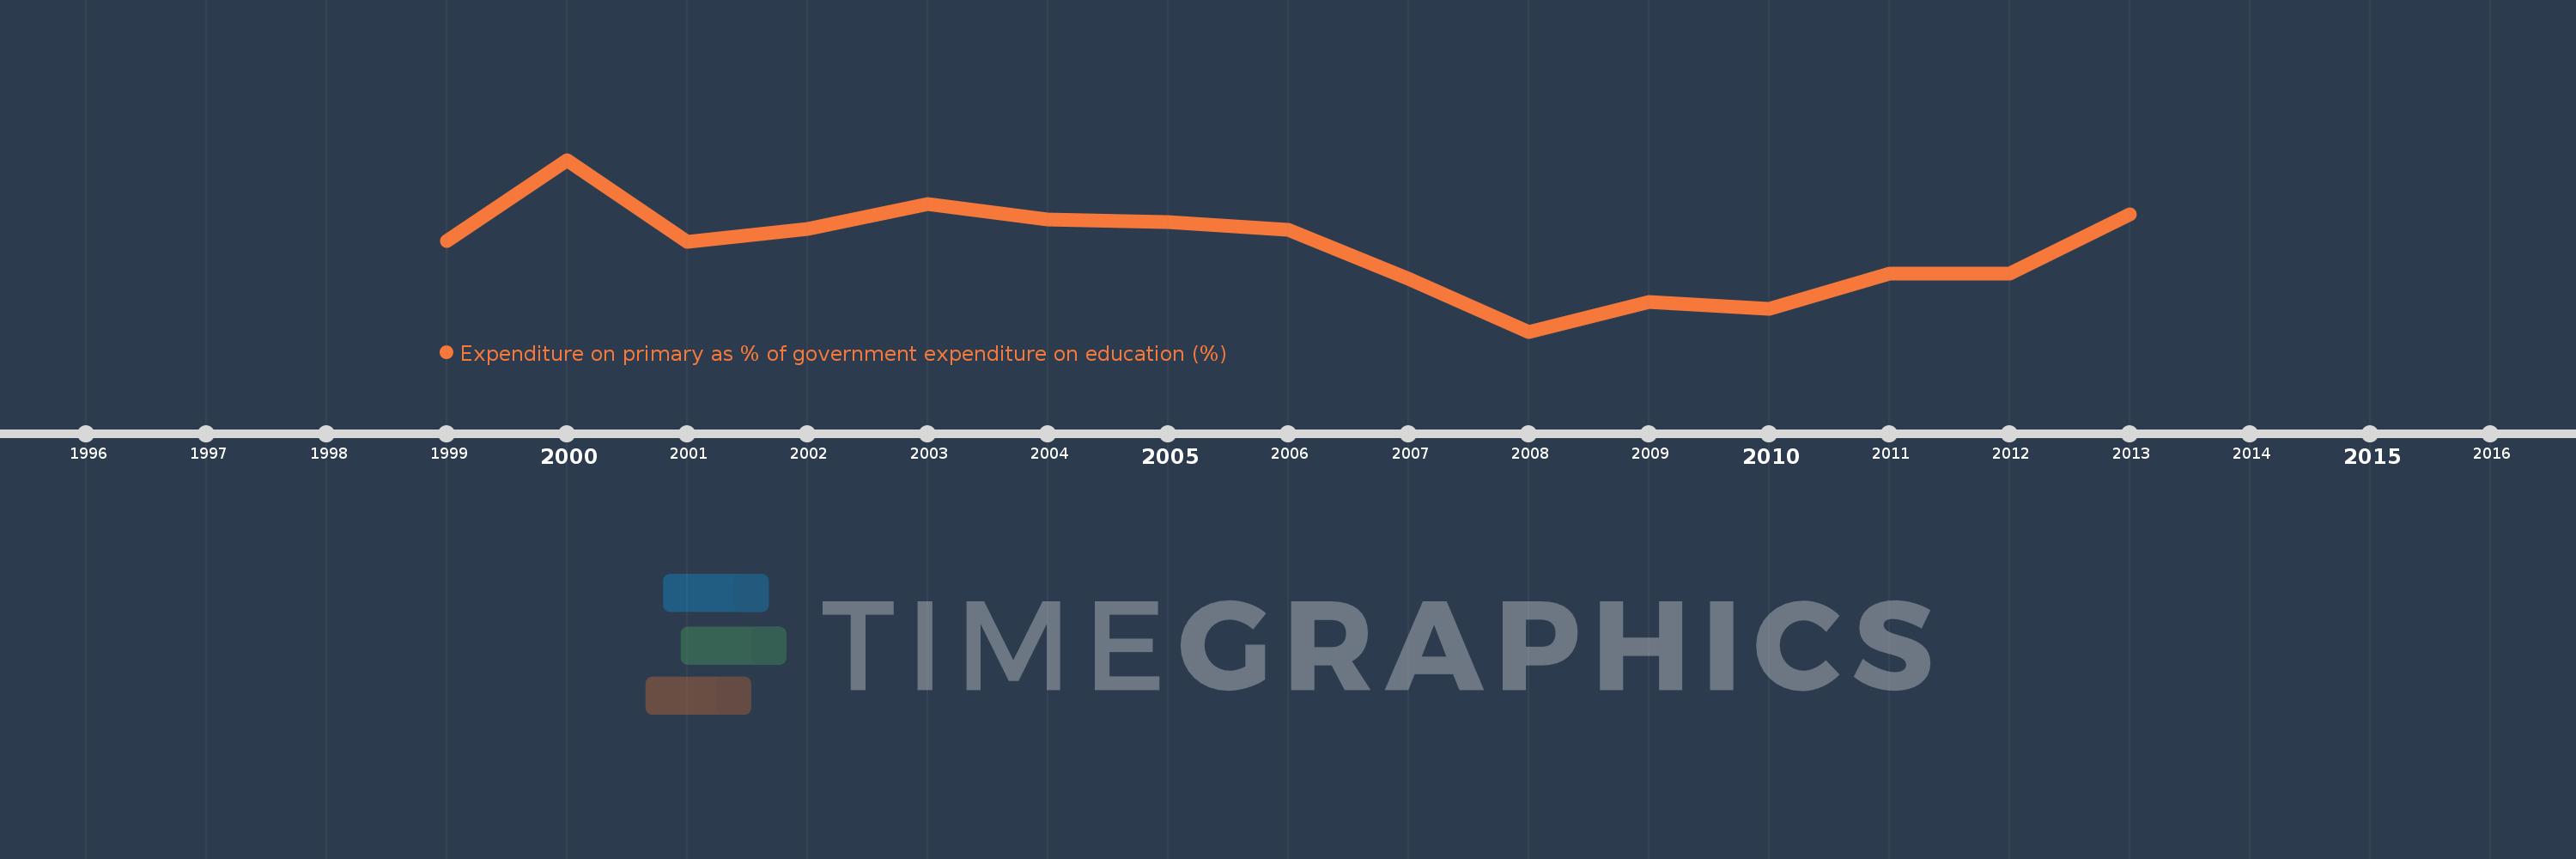
Expenditure on primary as % of government expenditure on education (%)
2013,2012,2011,2010,2009,2008,2007,2006,2005,2004,2003,2002,2001,2000,1999
This statistics in other country:
Timeline:
This timeline shows a graph from 1999 to 2013 of OECD members. No data until 1998. Number of actual observations by date: 15.
Source name:
World Development Indicators
Source organization:
UNESCO Institute for Statistics
Categories, topics:
Education
Last updated:
apr 23, 2017
Indicators value changes by year
Minimum:
25.047
jan 1, 2008
Maximum:
26.518
jan 1, 2000
At the date of observation
Value
Absolute change
Change from previous value
jan 1, 1999
25.823
+25.823
0.0%
jan 1, 2000
26.518
+0.695
2.69%
jan 1, 2001
25.818
-0.699
-2.64%
jan 1, 2002
25.928
+0.109
0.42%
jan 1, 2003
26.142
+0.214
0.83%
jan 1, 2004
26.01
-0.132
-0.51%
jan 1, 2005
25.983
-0.027
-0.1%
jan 1, 2006
25.917
-0.066
-0.25%
jan 1, 2007
25.5
-0.417
-1.61%
jan 1, 2008
25.047
-0.453
-1.78%
jan 1, 2009
25.301
+0.254
1.02%
jan 1, 2010
25.241
-0.06
-0.24%
jan 1, 2011
25.545
+0.303
1.2%
jan 1, 2012
25.545
0.0
0.0%
jan 1, 2013
26.048
+0.504
1.97%
Ranking of countries by current statistics by years


Comments: