29
/
en
AIzaSyAYiBZKx7MnpbEhh9jyipgxe19OcubqV5w
April 1, 2024
167409
Kenya
KEN
true
2
1
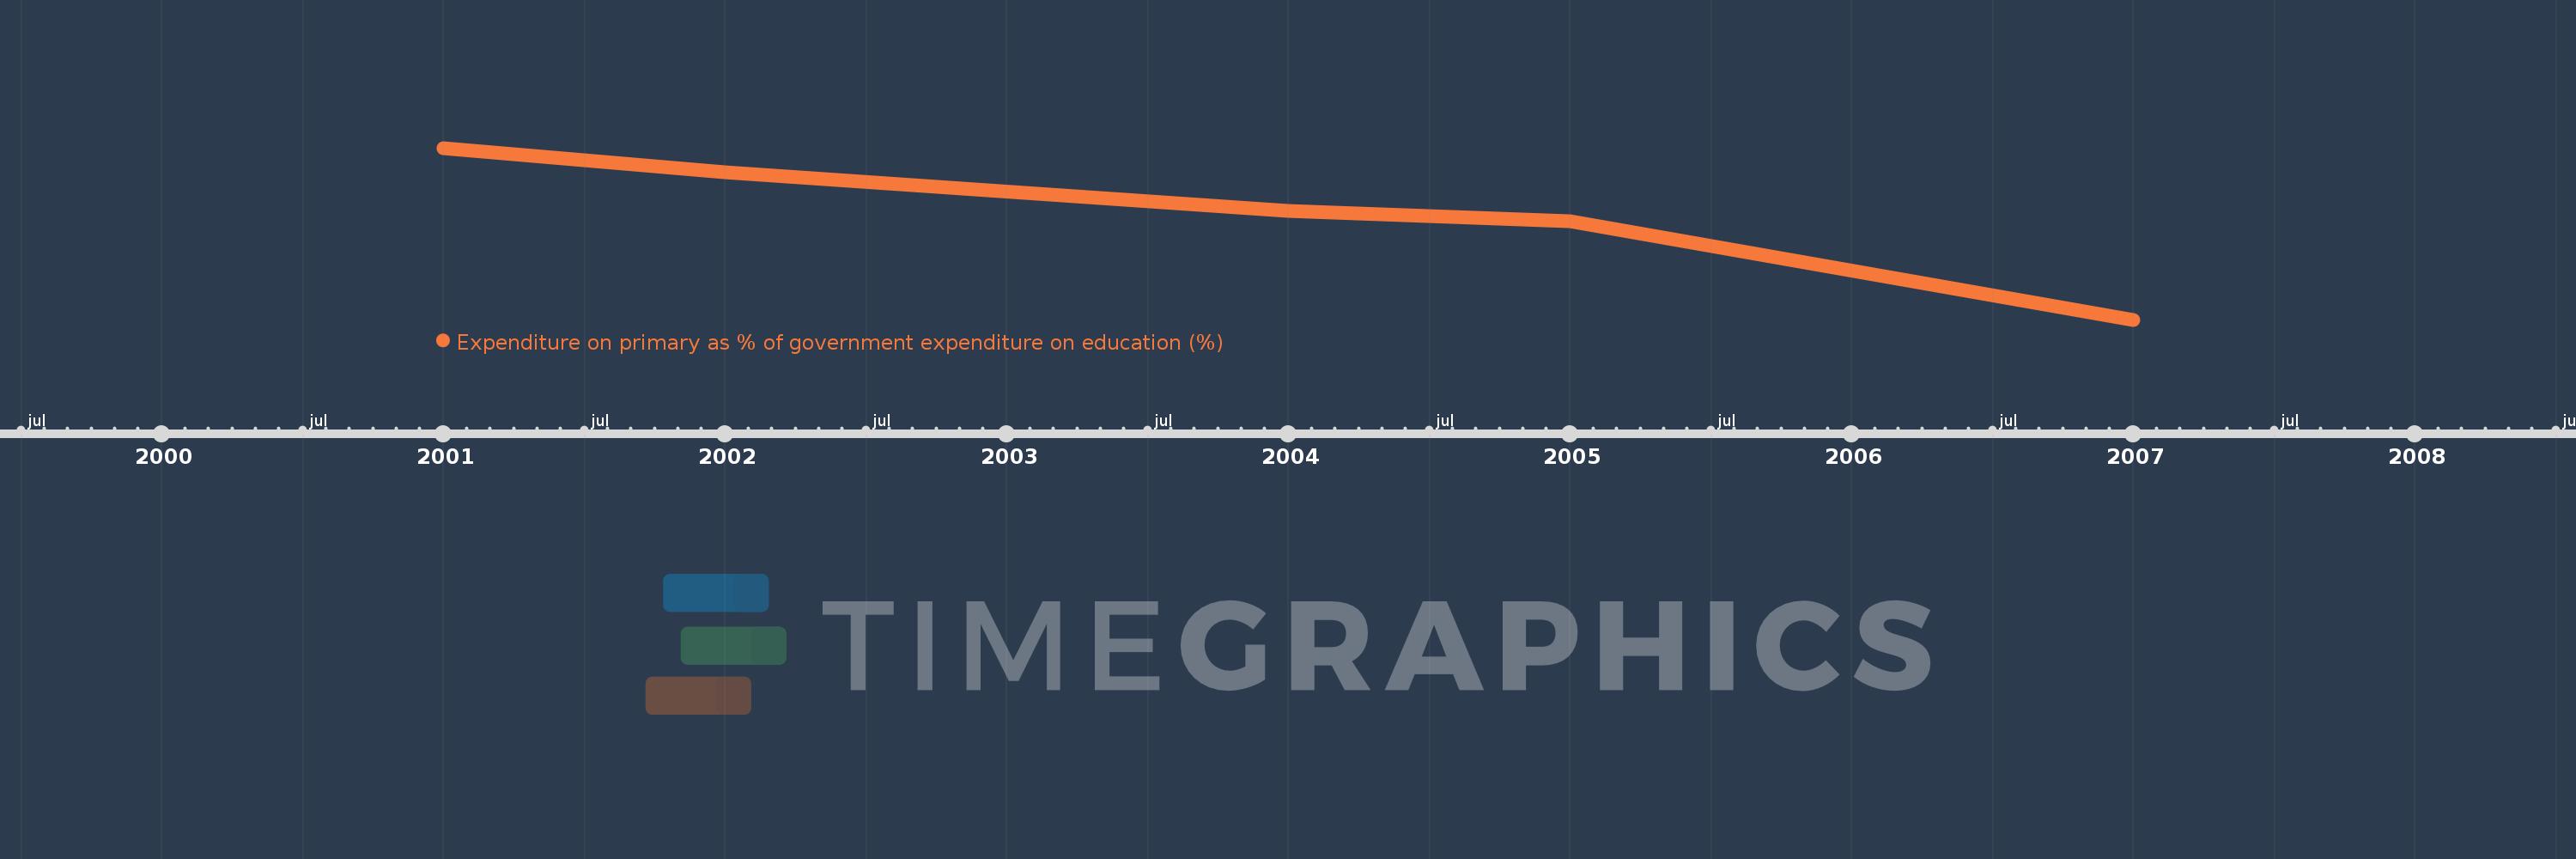
Expenditure on primary as % of government expenditure on education (%)
2007,2005,2004,2002,2001
This statistics in other country:
Timeline:
This timeline shows a graph from 2001 to 2007 of Kenya. No data until 2000. Number of actual observations by date: 5.
Source name:
World Development Indicators
Source organization:
UNESCO Institute for Statistics
Categories, topics:
Education
Last updated:
apr 23, 2017
Indicators value changes by year
Minimum:
54.109
jan 1, 2007
Maximum:
68.087
jan 1, 2001
At the date of observation
Value
Absolute change
Change from previous value
jan 1, 2001
68.087
+68.087
0.0%
jan 1, 2002
66.085
-2.003
-2.94%
jan 1, 2004
62.953
-3.132
-4.74%
jan 1, 2005
62.118
-0.835
-1.33%
jan 1, 2007
54.109
-8.009
-12.89%
Ranking of countries by current statistics by years


Comments: