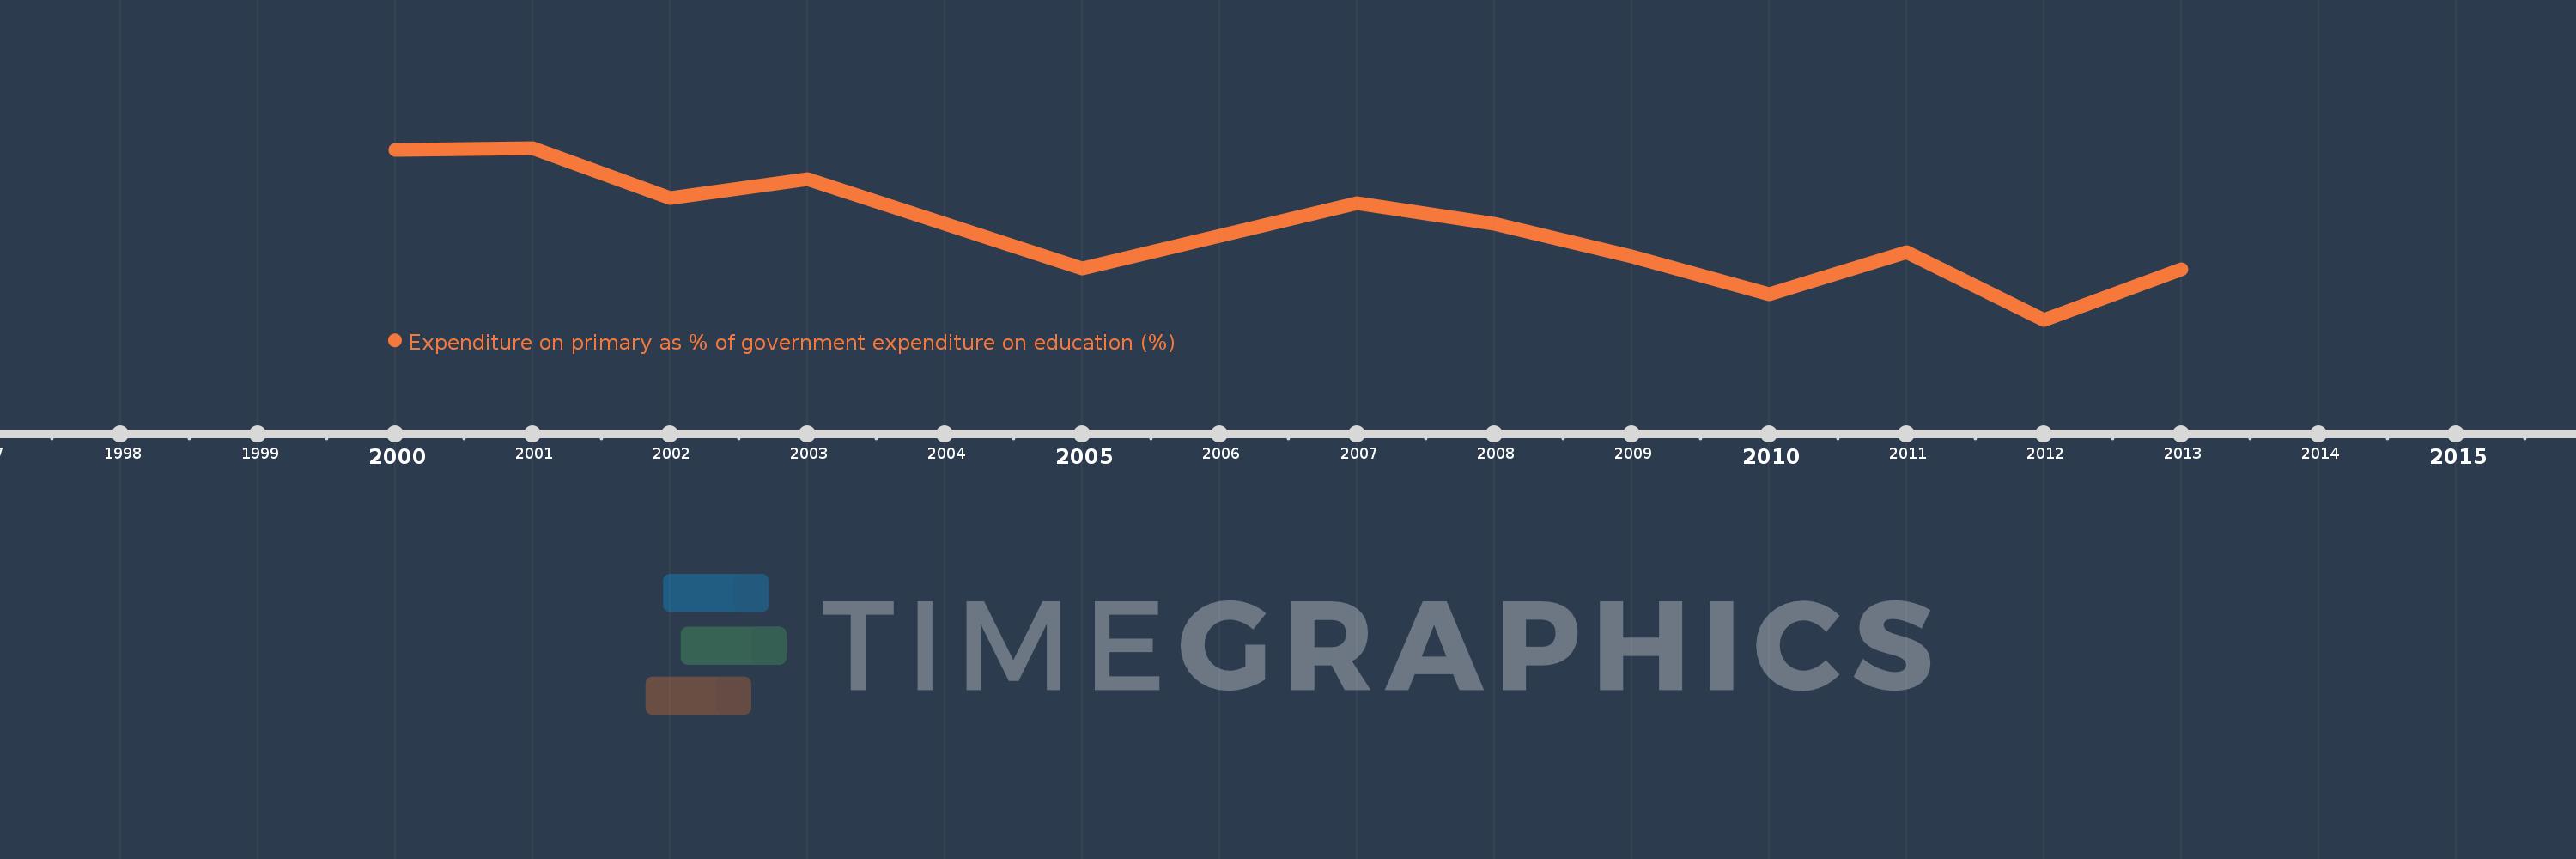
This timeline shows a graph from 2000 to 2013 of Latin America & Caribbean (excluding high income). No data until 1999. Number of actual observations by date: 12.
Source name:
World Development Indicators
Source organization:
UNESCO Institute for Statistics
Categories, topics:
Education
Last updated:
apr 23, 2017
Indicators value changes by year
Meaning:
38.053
Minimum:
35.483
jan 1, 2012
Maximum:
40.416
jan 1, 2001
At the date of observation
Value
Absolute change
Change from the previous value
jan 1, 2000
40.351
+40.351
0.0%
jan 1, 2001
40.416
+0.065
0.16%
jan 1, 2002
38.969
-1.447
-3.58%
jan 1, 2003
39.523
+0.554
1.42%
jan 1, 2005
36.958
-2.565
-6.49%
jan 1, 2007
38.821
+1.863
5.04%
jan 1, 2008
38.249
-0.572
-1.47%
jan 1, 2009
37.303
-0.946
-2.47%
jan 1, 2010
36.216
-1.086
-2.91%
jan 1, 2011
37.412
+1.195
3.3%
jan 1, 2012
35.483
-1.929
-5.16%
jan 1, 2013
36.93
+1.447
4.08%
Ranking of countries by current statistics by years
