29
/
en
AIzaSyAYiBZKx7MnpbEhh9jyipgxe19OcubqV5w
April 1, 2024
87144
Bolivia
BOL
true
2
1
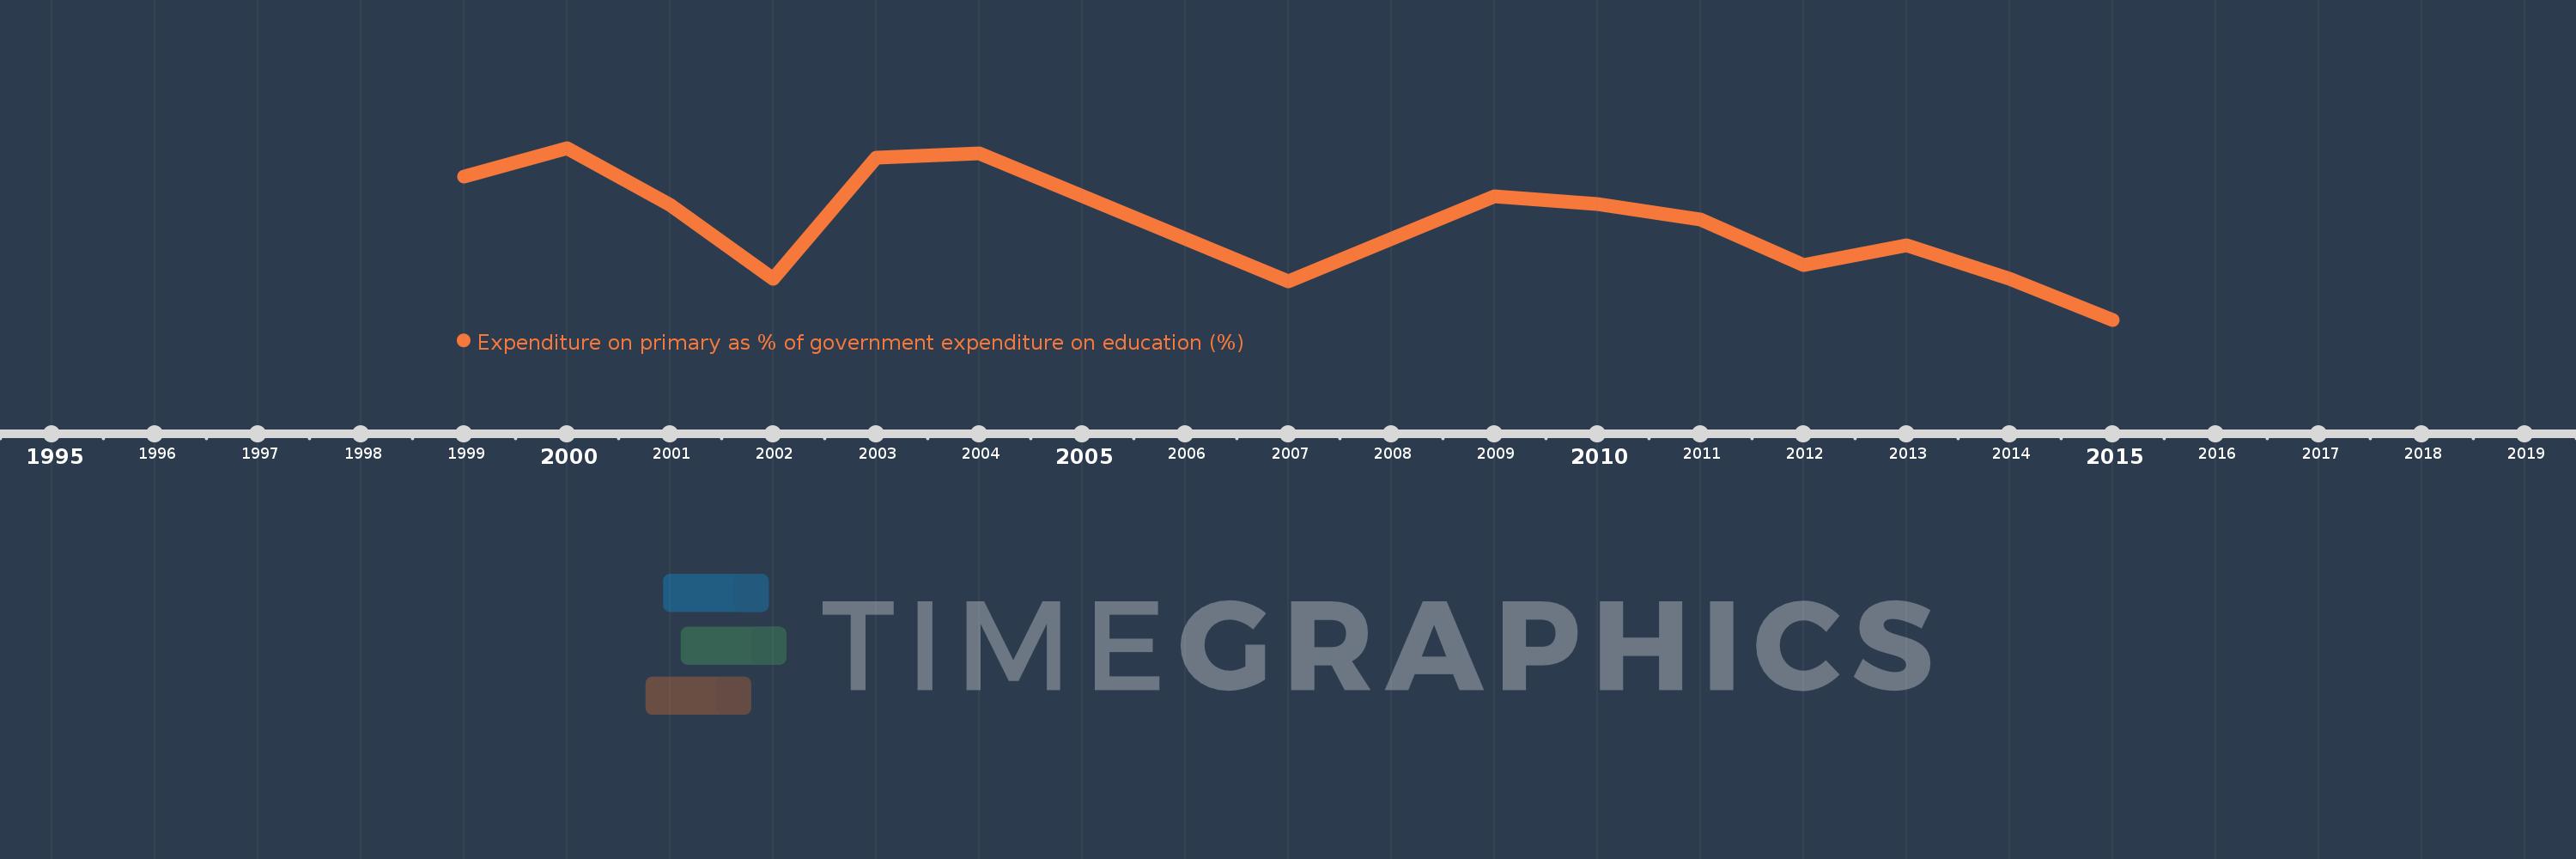
Expenditure on primary as % of government expenditure on education (%)
2015,2014,2013,2012,2011,2010,2009,2007,2004,2003,2002,2001,2000,1999
This statistics in other country:
Timeline:
This timeline shows a graph from 1999 to 2015 of Bolivia. No data until 1998. Number of actual observations by date: 14.
Source name:
World Development Indicators
Source organization:
UNESCO Institute for Statistics
Categories, topics:
Education
Last updated:
apr 23, 2017
Indicators value changes by year
Minimum:
32.352
jan 1, 2015
Maximum:
44.495
jan 1, 2000
At the date of observation
Value
Absolute change
Change from previous value
jan 1, 1999
42.487
+42.487
0.0%
jan 1, 2000
44.495
+2.008
4.73%
jan 1, 2001
40.481
-4.013
-9.02%
jan 1, 2002
35.269
-5.213
-12.88%
jan 1, 2003
43.792
+8.523
24.17%
jan 1, 2004
44.127
+0.336
0.77%
jan 1, 2007
35.069
-9.058
-20.53%
jan 1, 2009
41.092
+6.023
17.17%
jan 1, 2010
40.502
-0.59
-1.44%
jan 1, 2011
39.417
-1.084
-2.68%
jan 1, 2012
36.208
-3.209
-8.14%
jan 1, 2013
37.594
+1.385
3.83%
jan 1, 2014
35.248
-2.346
-6.24%
jan 1, 2015
32.352
-2.896
-8.21%
Ranking of countries by current statistics by years


Comments: