29
/
en
AIzaSyAYiBZKx7MnpbEhh9jyipgxe19OcubqV5w
April 1, 2024
255097
Swaziland
SWZ
true
2
1
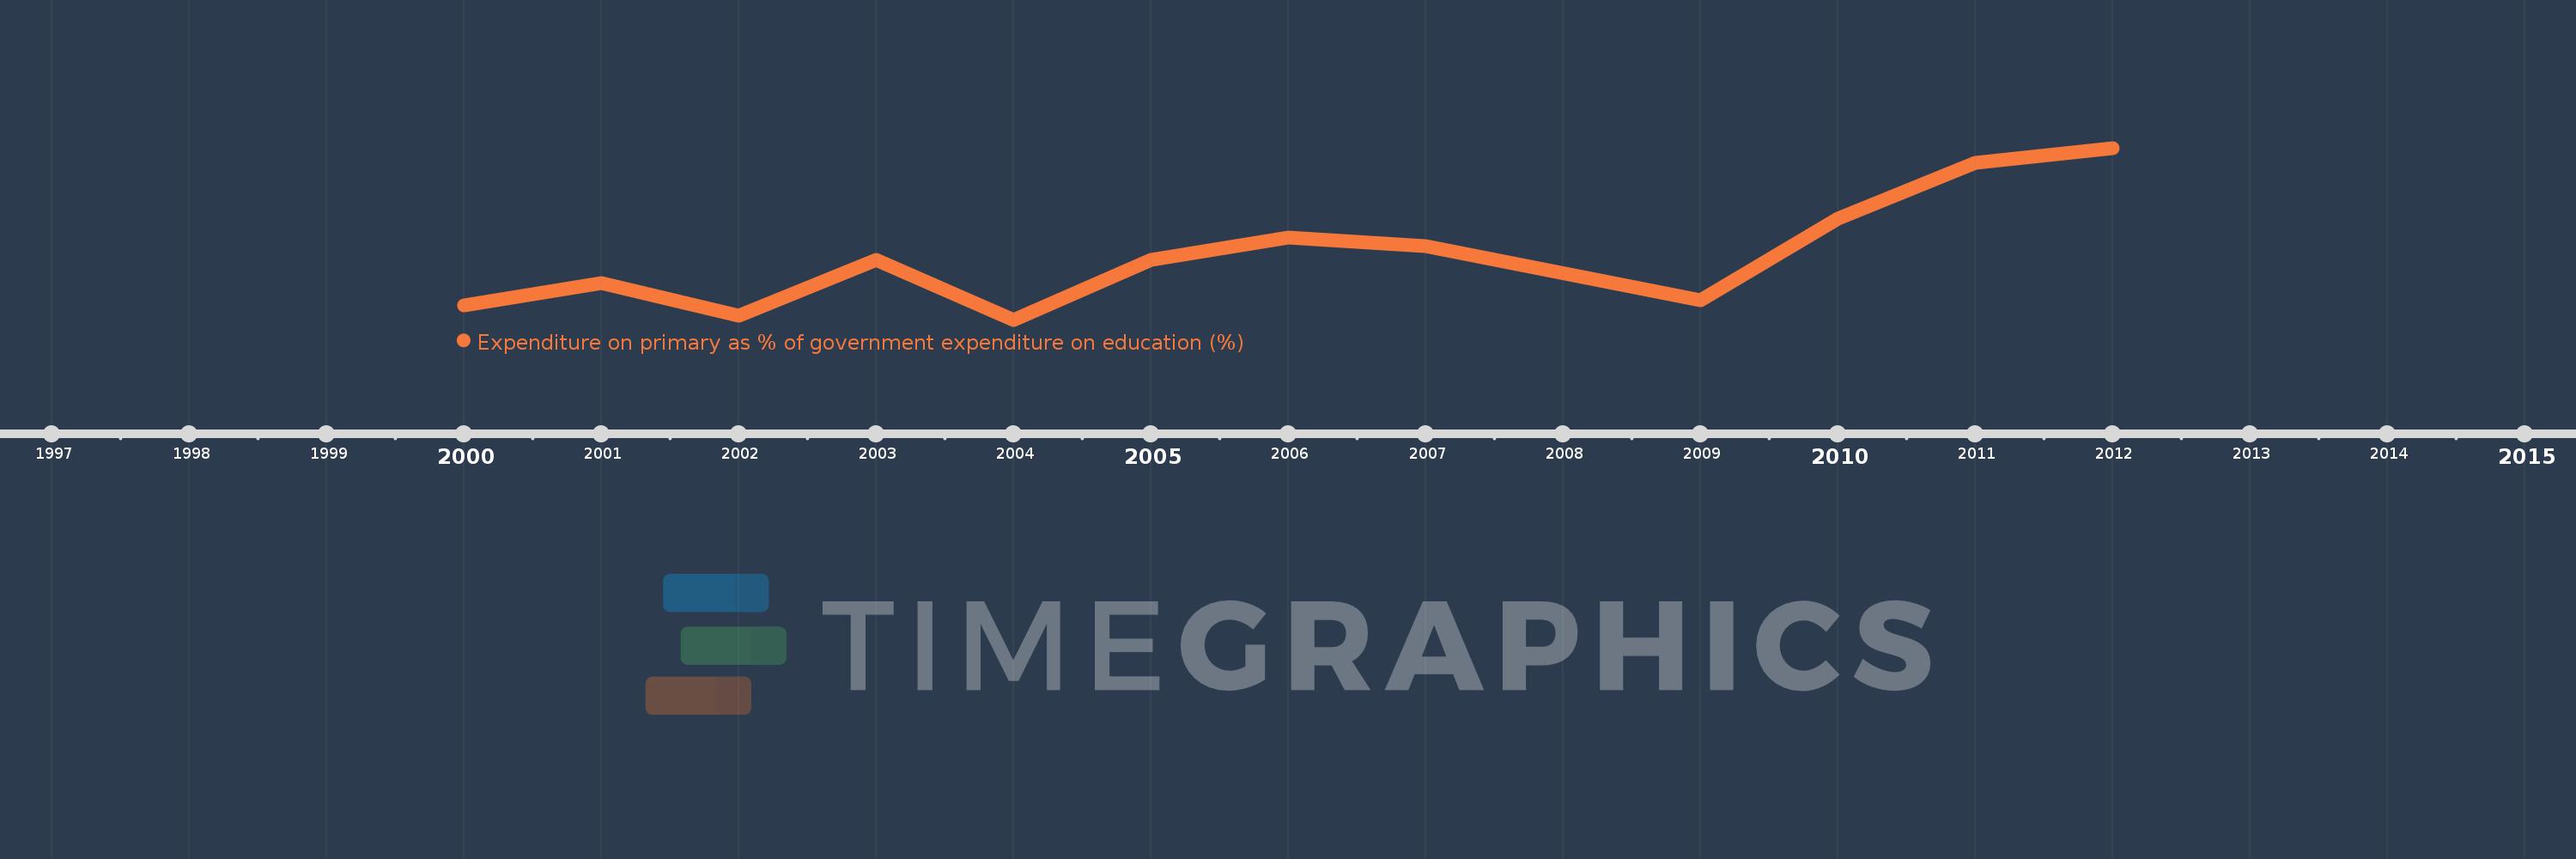
Expenditure on primary as % of government expenditure on education (%)
2012,2011,2010,2009,2007,2006,2005,2004,2003,2002,2001,2000
This statistics in other country:
Timeline:
This timeline shows a graph from 2000 to 2012 of Swaziland. No data until 1999. Number of actual observations by date: 12.
Source name:
World Development Indicators
Source organization:
UNESCO Institute for Statistics
Categories, topics:
Education
Last updated:
apr 23, 2017
Indicators value changes by year
Maximum:
48.669
jan 1, 2012
At the date of observation
Value
Absolute change
Change from previous value
jan 1, 2000
33.153
+33.153
0.0%
jan 1, 2001
35.359
+2.206
6.65%
jan 1, 2002
32.114
-3.245
-9.18%
jan 1, 2003
37.66
+5.546
17.27%
jan 1, 2004
31.75
-5.91
-15.69%
jan 1, 2005
37.655
+5.906
18.6%
jan 1, 2006
39.859
+2.204
5.85%
jan 1, 2007
38.992
-0.868
-2.18%
jan 1, 2009
33.63
-5.362
-13.75%
jan 1, 2010
41.737
+8.108
24.11%
jan 1, 2011
47.165
+5.427
13.0%
jan 1, 2012
48.669
+1.504
3.19%
Ranking of countries by current statistics by years


Comments: