29
/
en
AIzaSyAYiBZKx7MnpbEhh9jyipgxe19OcubqV5w
April 1, 2024
46044
Low income
LIC
false
2
1
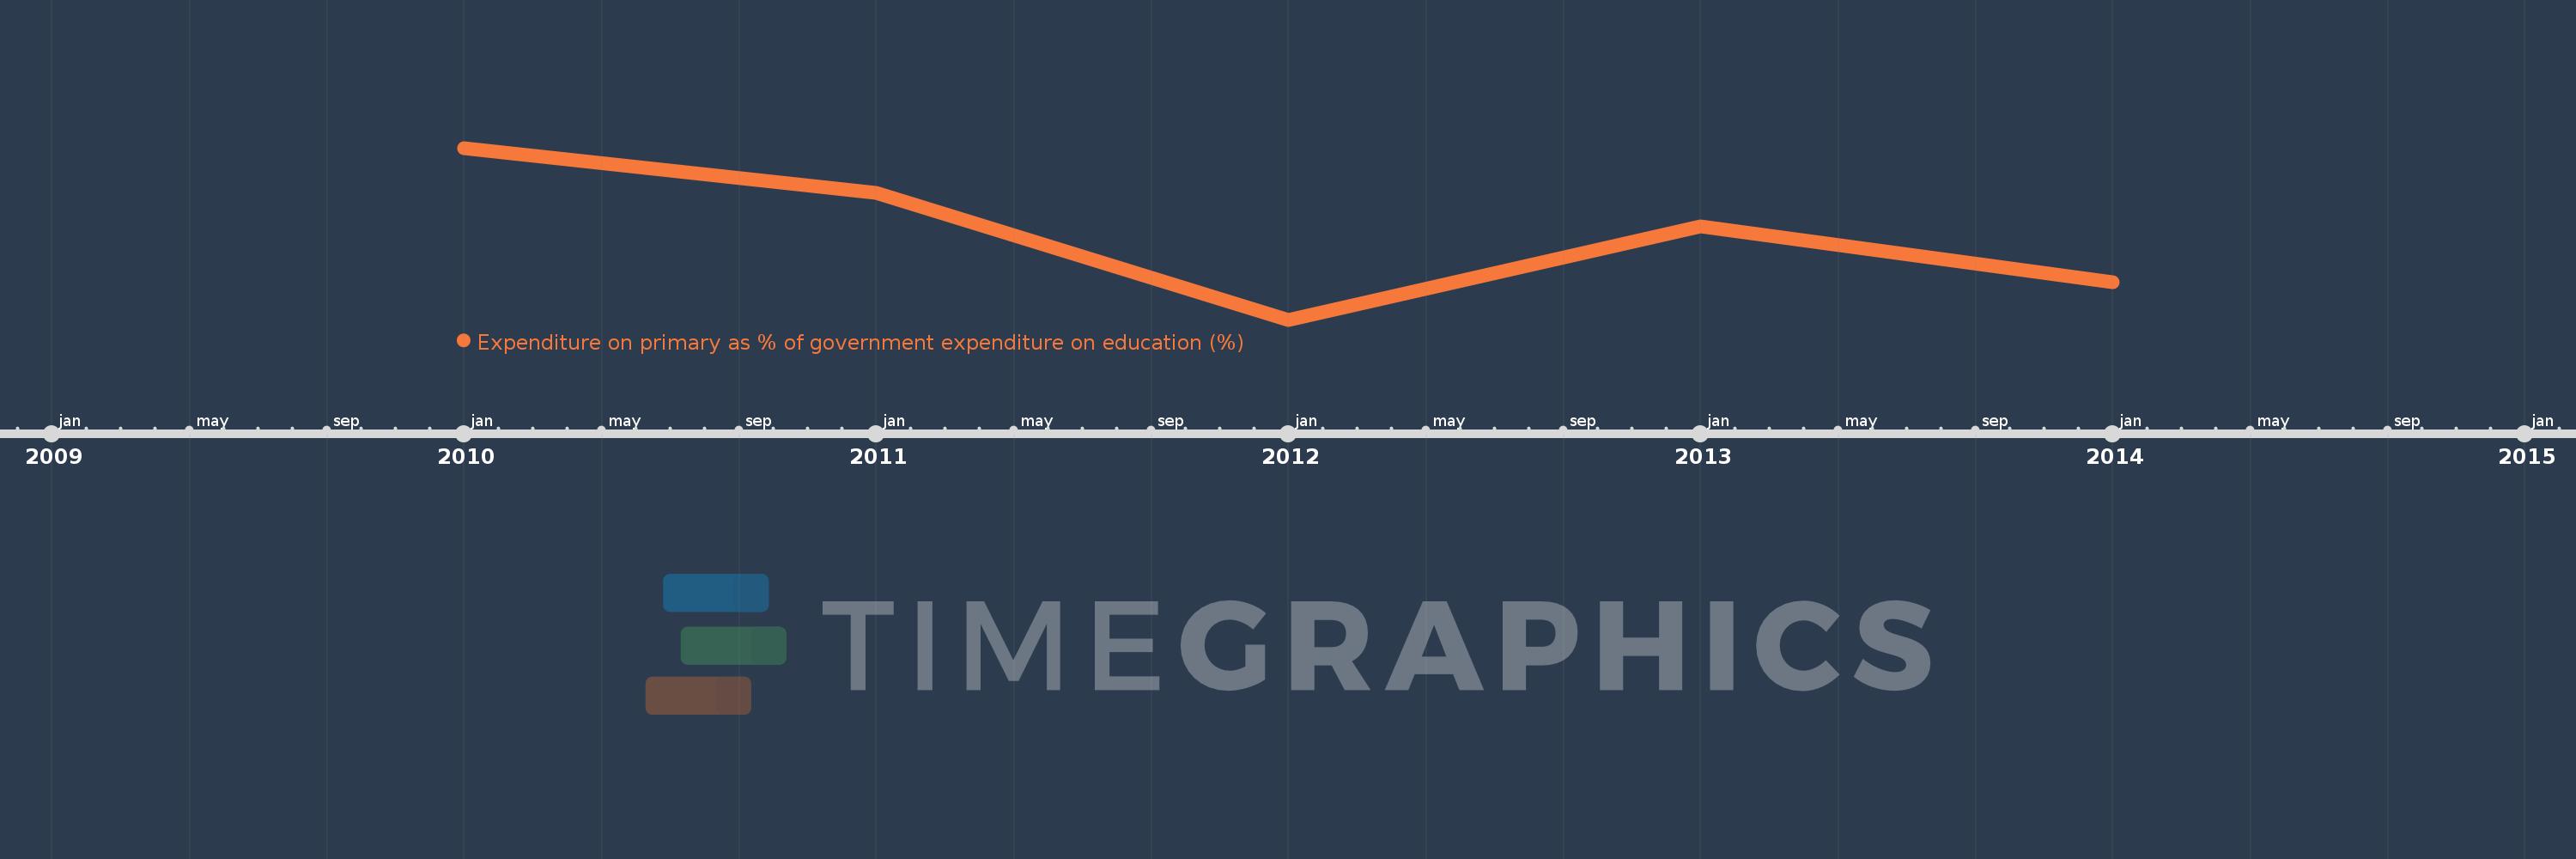
Expenditure on primary as % of government expenditure on education (%)
2014,2013,2012,2011,2010
This statistics in other country:
Timeline:
This timeline shows a graph from 2010 to 2014 of Low income. No data until 2009. Number of actual observations by date: 5.
Source name:
World Development Indicators
Source organization:
UNESCO Institute for Statistics
Categories, topics:
Education
Last updated:
apr 23, 2017
Indicators value changes by year
Minimum:
49.253
jan 1, 2012
Maximum:
51.243
jan 1, 2010
At the date of observation
Value
Absolute change
Change from previous value
jan 1, 2010
51.243
+51.243
0.0%
jan 1, 2011
50.723
-0.52
-1.01%
jan 1, 2012
49.253
-1.47
-2.9%
jan 1, 2013
50.33
+1.078
2.19%
jan 1, 2014
49.688
-0.643
-1.28%
Ranking of countries by current statistics by years


Comments: