29
/
en
AIzaSyAYiBZKx7MnpbEhh9jyipgxe19OcubqV5w
April 1, 2024
209255
New Zealand
NZL
true
2
1
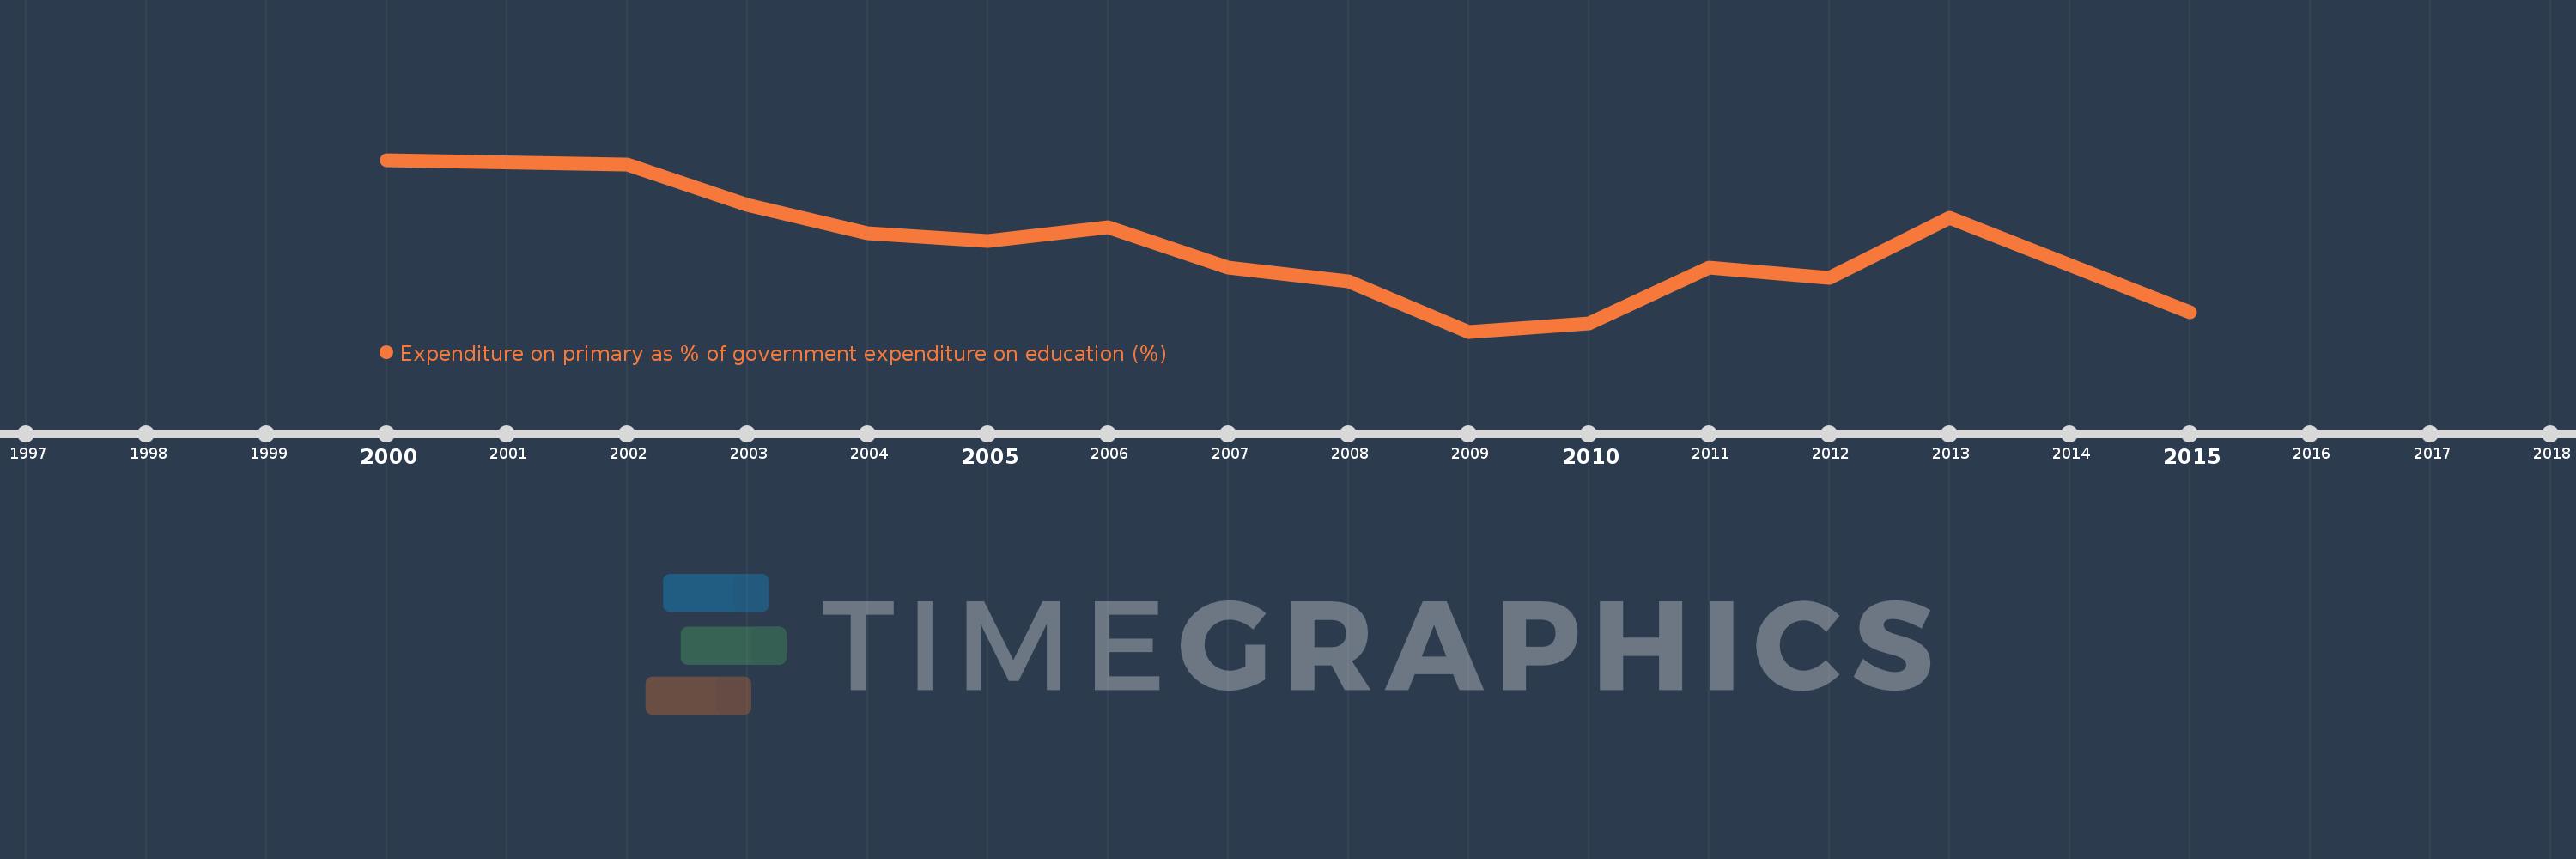
Expenditure on primary as % of government expenditure on education (%)
2015,2013,2012,2011,2010,2009,2008,2007,2006,2005,2004,2003,2002,2000
This statistics in other country:
Timeline:
This timeline shows a graph from 2000 to 2015 of New Zealand. No data until 1999. Number of actual observations by date: 14.
Source name:
World Development Indicators
Source organization:
UNESCO Institute for Statistics
Categories, topics:
Education
Last updated:
apr 23, 2017
Indicators value changes by year
Minimum:
22.373
jan 1, 2009
Maximum:
27.907
jan 1, 2000
At the date of observation
Value
Absolute change
Change from previous value
jan 1, 2000
27.907
+27.907
0.0%
jan 1, 2002
27.747
-0.16
-0.57%
jan 1, 2003
26.466
-1.281
-4.62%
jan 1, 2004
25.551
-0.915
-3.46%
jan 1, 2005
25.28
-0.271
-1.06%
jan 1, 2006
25.741
+0.461
1.82%
jan 1, 2007
24.429
-1.312
-5.1%
jan 1, 2008
23.986
-0.443
-1.82%
jan 1, 2009
22.373
-1.613
-6.72%
jan 1, 2010
22.646
+0.273
1.22%
jan 1, 2011
24.43
+1.783
7.88%
jan 1, 2012
24.109
-0.321
-1.31%
jan 1, 2013
26.048
+1.94
8.05%
jan 1, 2015
22.999
-3.049
-11.71%
Ranking of countries by current statistics by years


Comments: