29
/
en
AIzaSyAYiBZKx7MnpbEhh9jyipgxe19OcubqV5w
April 1, 2024
263416
Timor-Leste
TLS
true
2
1
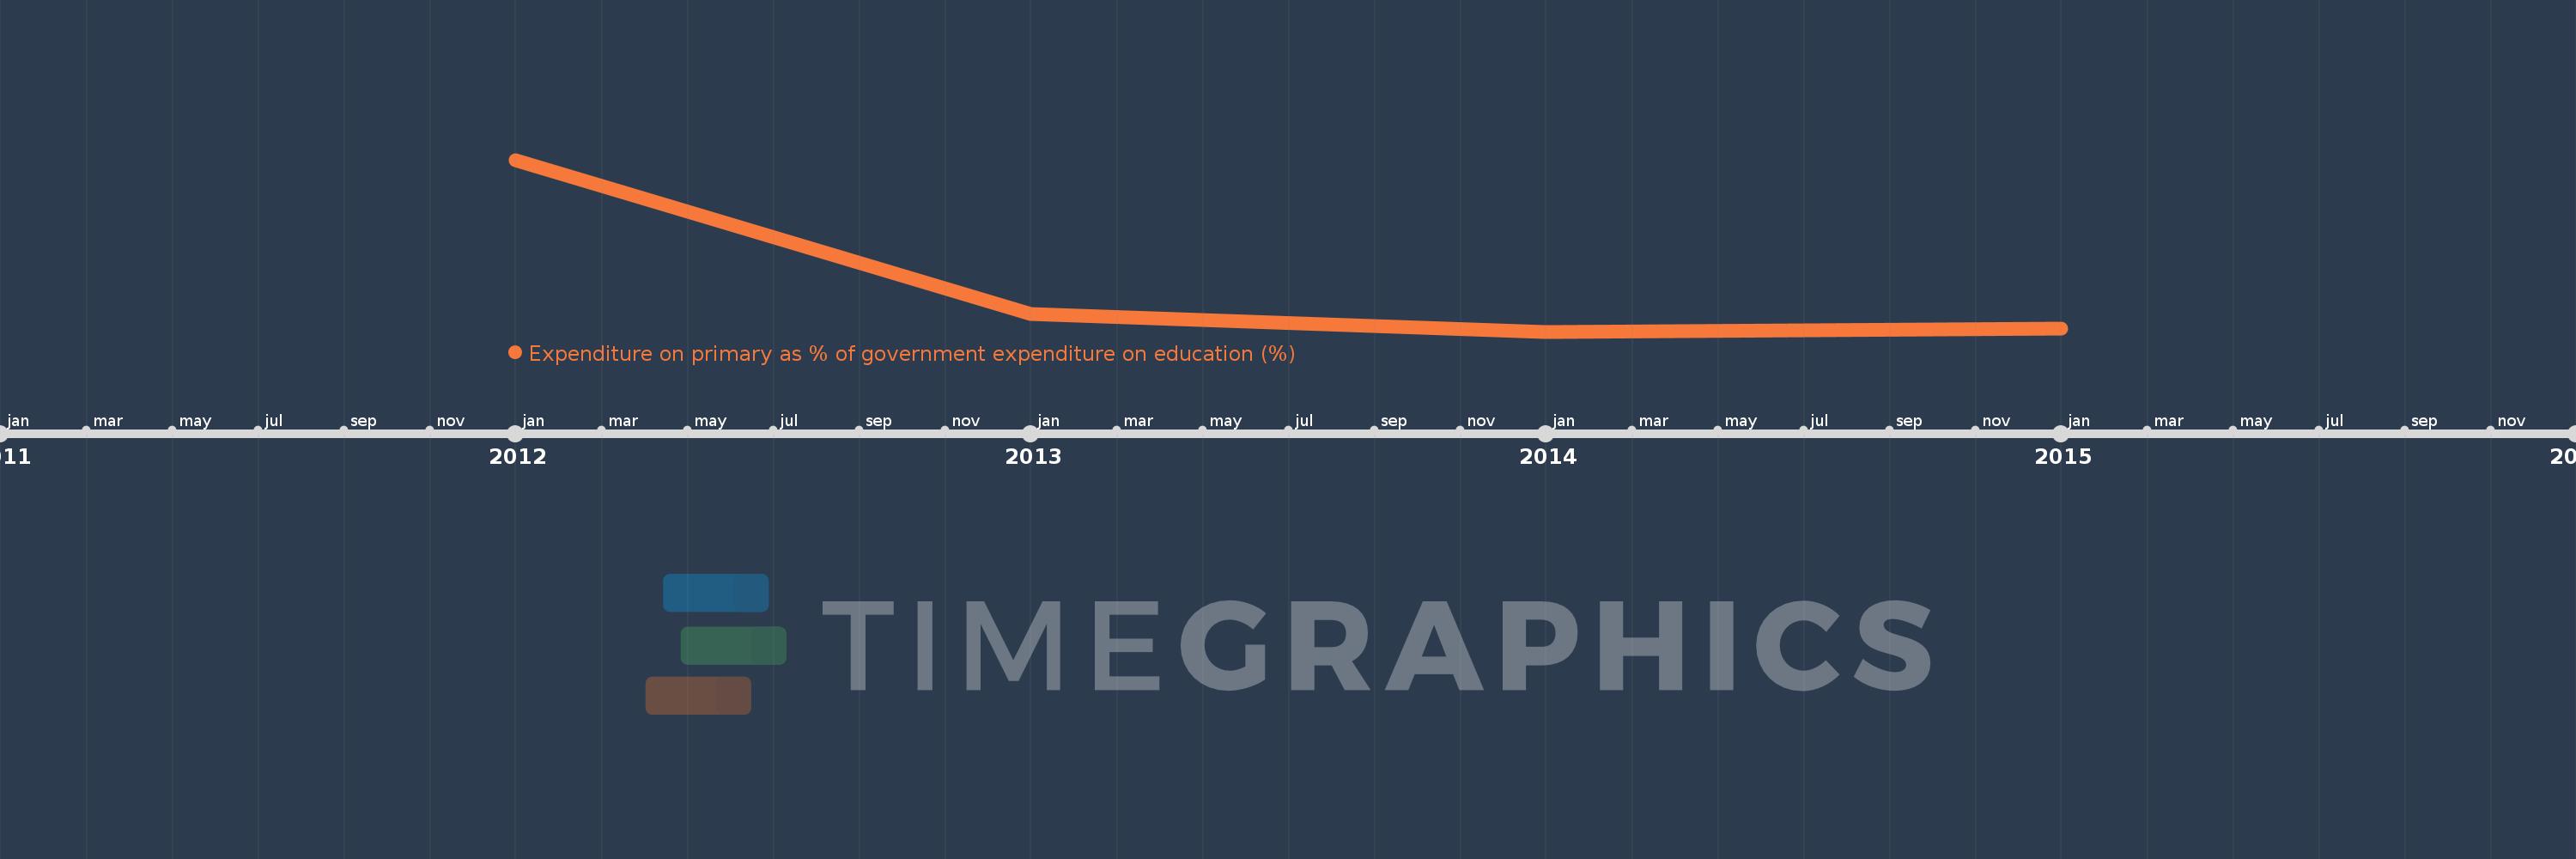
Expenditure on primary as % of government expenditure on education (%)
2015,2014,2013,2012
This statistics in other country:
Timeline:
This timeline shows a graph from 2012 to 2015 of Timor-Leste. No data until 2011. Number of actual observations by date: 4.
Source name:
World Development Indicators
Source organization:
UNESCO Institute for Statistics
Categories, topics:
Education
Last updated:
apr 23, 2017
Indicators value changes by year
Maximum:
72.758
jan 1, 2012
At the date of observation
Value
Absolute change
Change from previous value
jan 1, 2012
72.758
+72.758
0.0%
jan 1, 2013
65.555
-7.203
-9.9%
jan 1, 2014
64.74
-0.815
-1.24%
jan 1, 2015
64.891
+0.152
0.23%
Ranking of countries by current statistics by years


Comments: