29
/
en
AIzaSyAYiBZKx7MnpbEhh9jyipgxe19OcubqV5w
April 1, 2024
247476
Spain
ESP
true
2
1
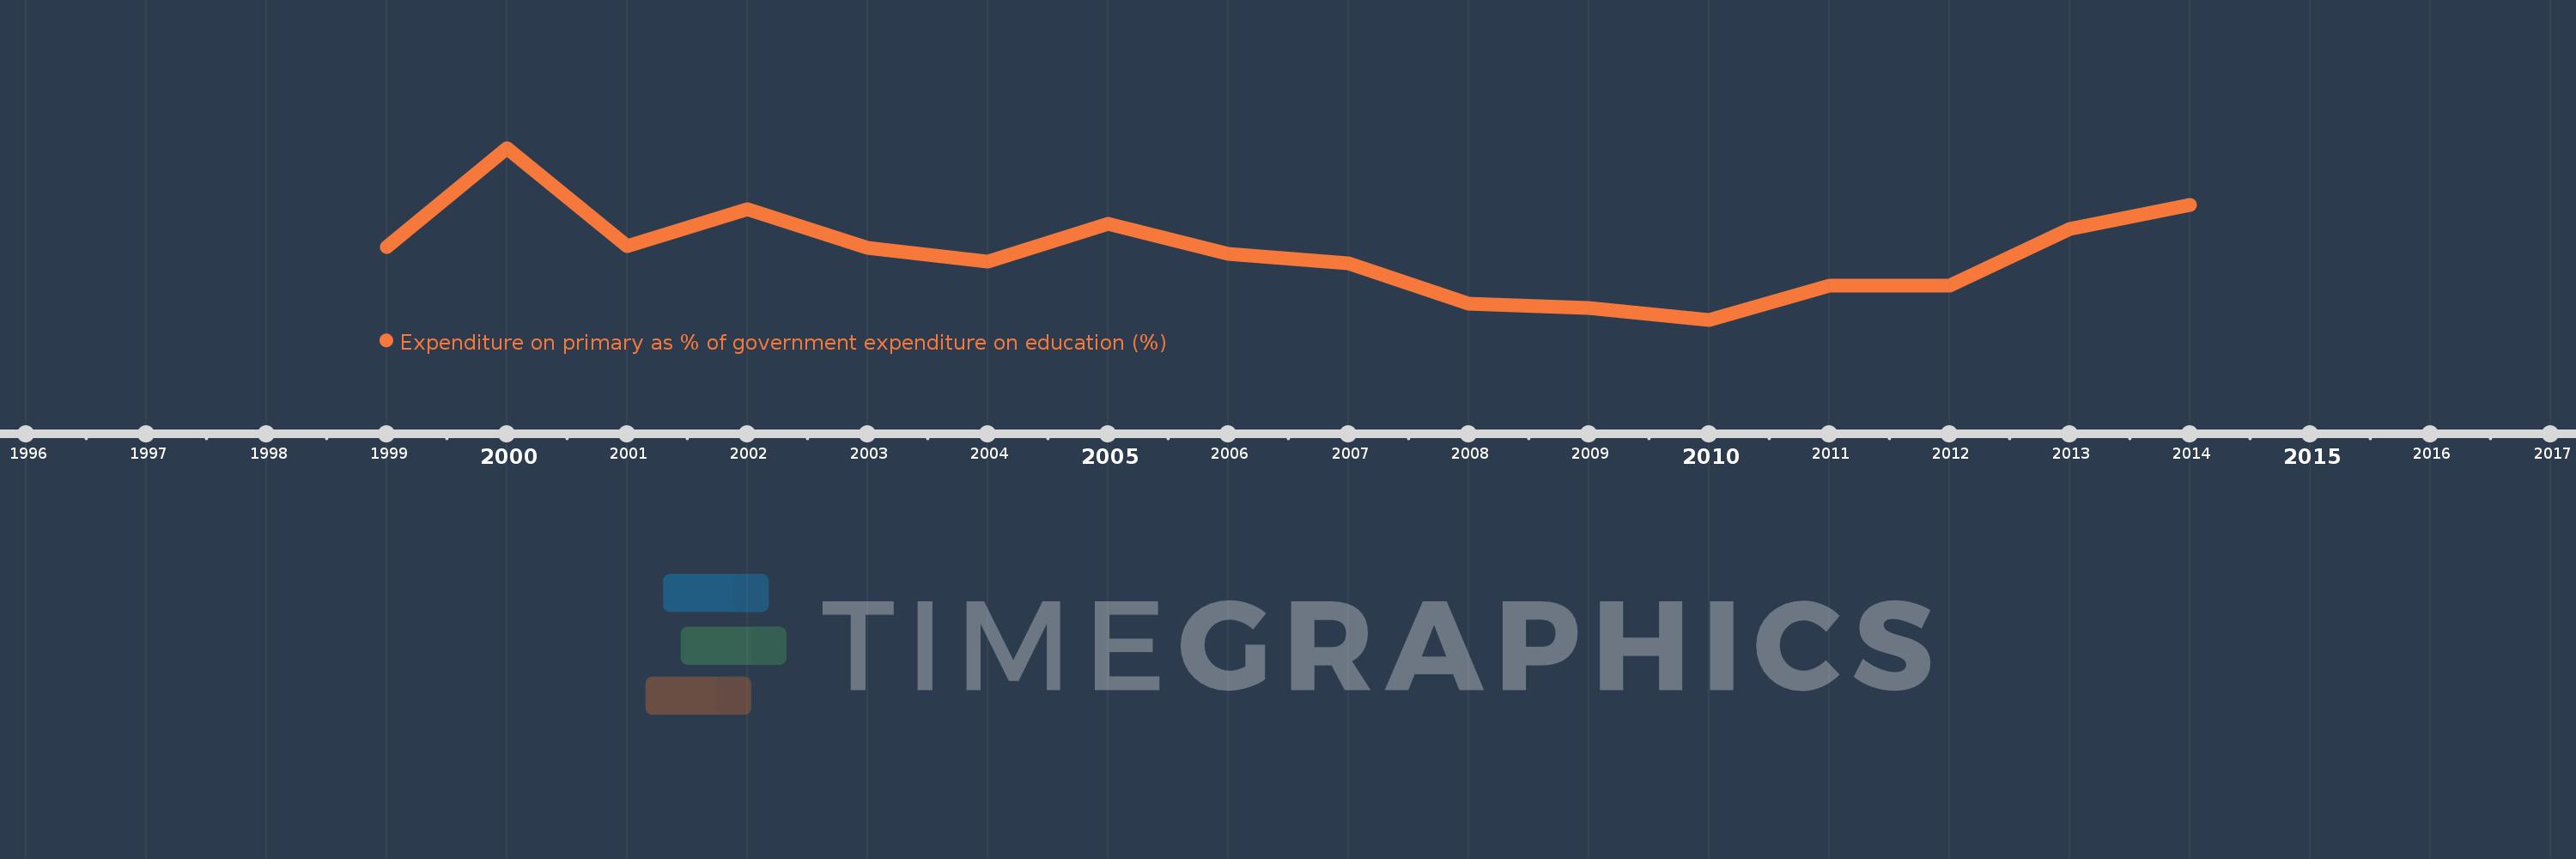
Expenditure on primary as % of government expenditure on education (%)
2014,2013,2012,2011,2010,2009,2008,2007,2006,2005,2004,2003,2002,2001,2000,1999
This statistics in other country:
Timeline:
This timeline shows a graph from 1999 to 2014 of Spain. No data until 1998. Number of actual observations by date: 16.
Source name:
World Development Indicators
Source organization:
UNESCO Institute for Statistics
Categories, topics:
Education
Last updated:
apr 23, 2017
Indicators value changes by year
Minimum:
25.304
jan 1, 2010
Maximum:
26.525
jan 1, 2000
At the date of observation
Value
Absolute change
Change from previous value
jan 1, 1999
25.823
+25.823
0.0%
jan 1, 2000
26.525
+0.703
2.72%
jan 1, 2001
25.826
-0.699
-2.63%
jan 1, 2002
26.09
+0.263
1.02%
jan 1, 2003
25.818
-0.271
-1.04%
jan 1, 2004
25.717
-0.101
-0.39%
jan 1, 2005
25.983
+0.266
1.03%
jan 1, 2006
25.774
-0.208
-0.8%
jan 1, 2007
25.707
-0.067
-0.26%
jan 1, 2008
25.417
-0.29
-1.13%
jan 1, 2009
25.388
-0.029
-0.11%
jan 1, 2010
25.304
-0.084
-0.33%
jan 1, 2011
25.545
+0.241
0.95%
jan 1, 2012
25.545
0.0
0.0%
jan 1, 2013
25.949
+0.404
1.58%
jan 1, 2014
26.12
+0.171
0.66%
Ranking of countries by current statistics by years


Comments: