29
/
en
AIzaSyAYiBZKx7MnpbEhh9jyipgxe19OcubqV5w
April 1, 2024
151516
Hong Kong SAR, China
HKG
true
2
1
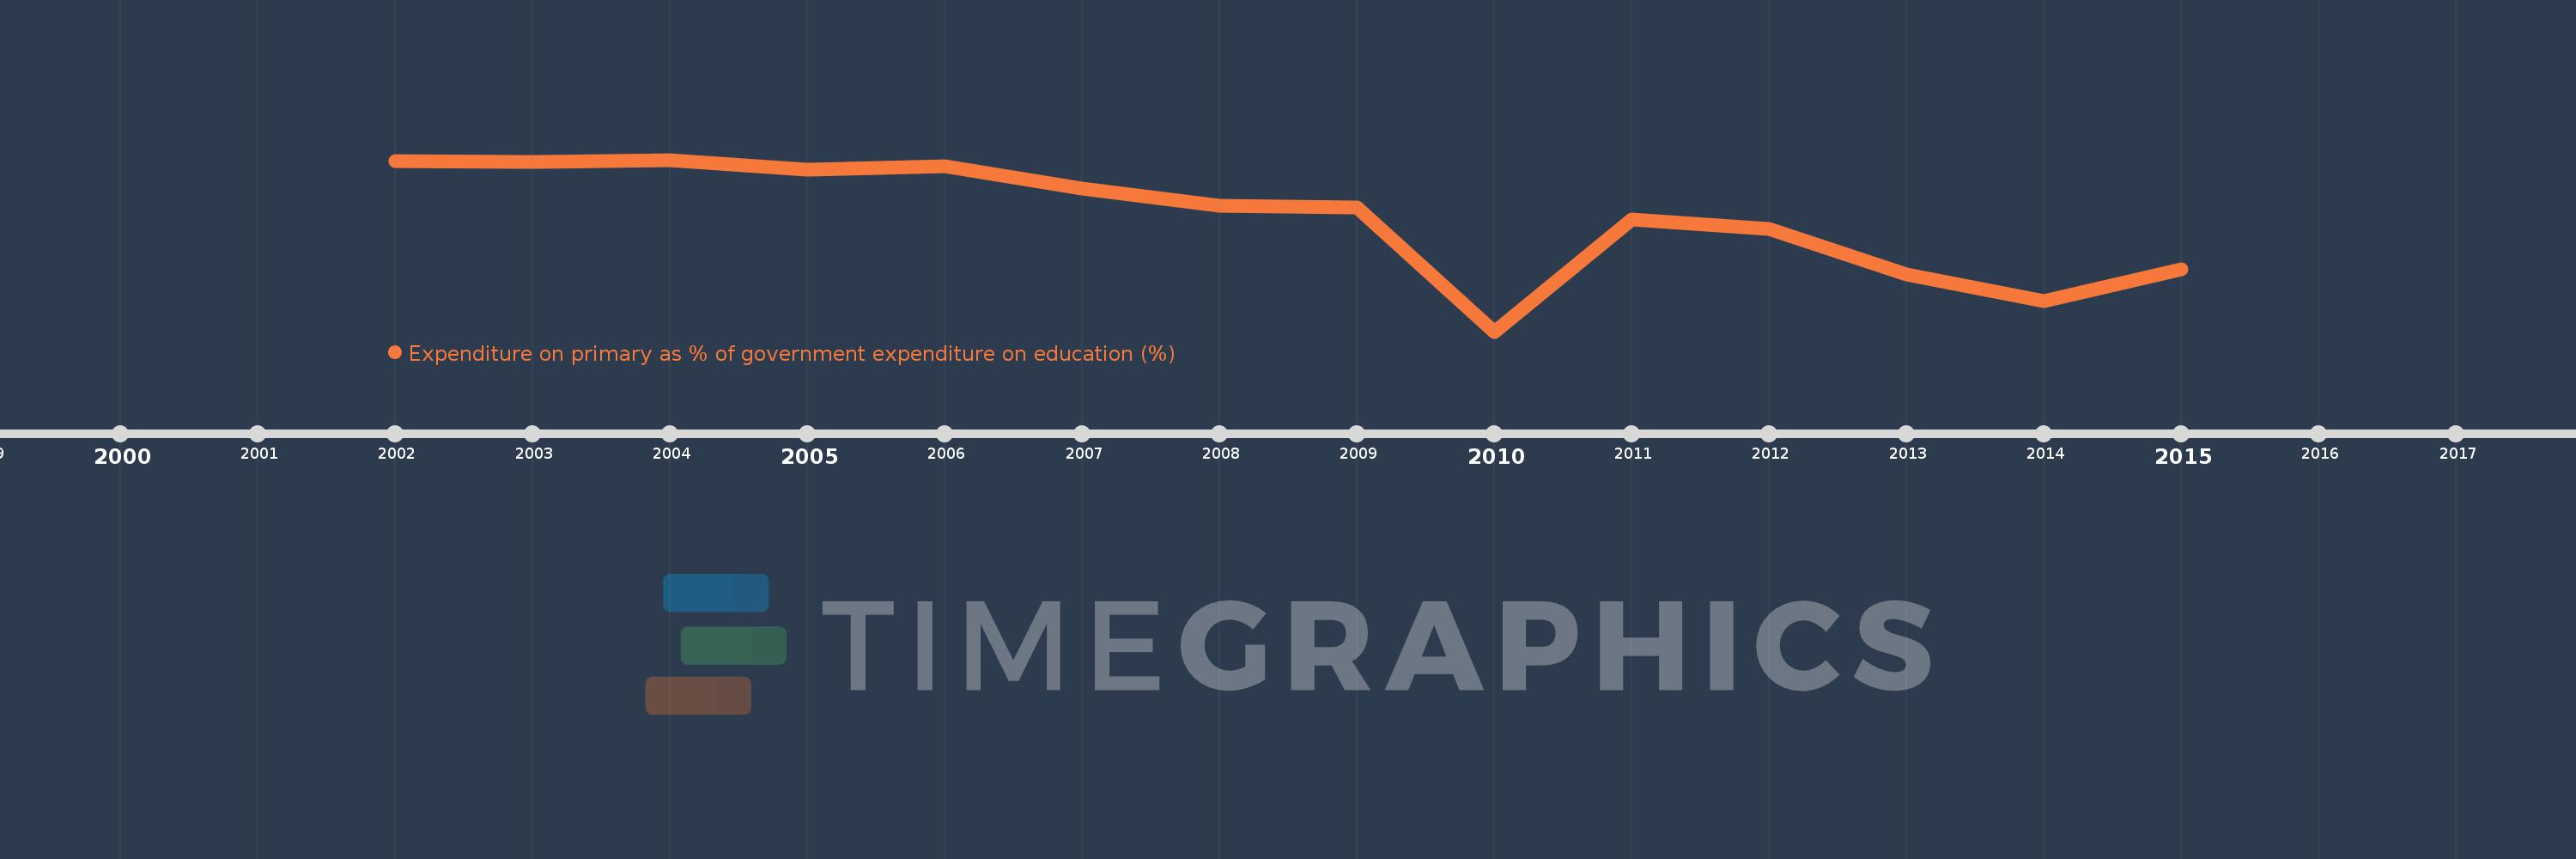
Expenditure on primary as % of government expenditure on education (%)
2015,2014,2013,2012,2011,2010,2009,2008,2007,2006,2005,2004,2003,2002
This statistics in other country:
Timeline:
This timeline shows a graph from 2002 to 2015 of Hong Kong SAR, China. No data until 2001. Number of actual observations by date: 14.
Source name:
World Development Indicators
Source organization:
UNESCO Institute for Statistics
Categories, topics:
Education
Last updated:
apr 23, 2017
Indicators value changes by year
Minimum:
16.282
jan 1, 2010
At the date of observation
Value
Absolute change
Change from previous value
jan 1, 2002
23.328
+23.328
0.0%
jan 1, 2003
23.285
-0.043
-0.18%
jan 1, 2004
23.38
+0.095
0.41%
jan 1, 2005
22.972
-0.408
-1.74%
jan 1, 2006
23.107
+0.135
0.59%
jan 1, 2007
22.206
-0.901
-3.9%
jan 1, 2008
21.473
-0.732
-3.3%
jan 1, 2009
21.397
-0.076
-0.36%
jan 1, 2010
16.282
-5.115
-23.9%
jan 1, 2011
20.931
+4.648
28.55%
jan 1, 2012
20.506
-0.425
-2.03%
jan 1, 2013
18.65
-1.855
-9.05%
jan 1, 2014
17.544
-1.106
-5.93%
jan 1, 2015
18.854
+1.31
7.46%
Ranking of countries by current statistics by years


Comments: