29
/
en
AIzaSyAYiBZKx7MnpbEhh9jyipgxe19OcubqV5w
April 1, 2024
69730
Argentina
ARG
true
2
1
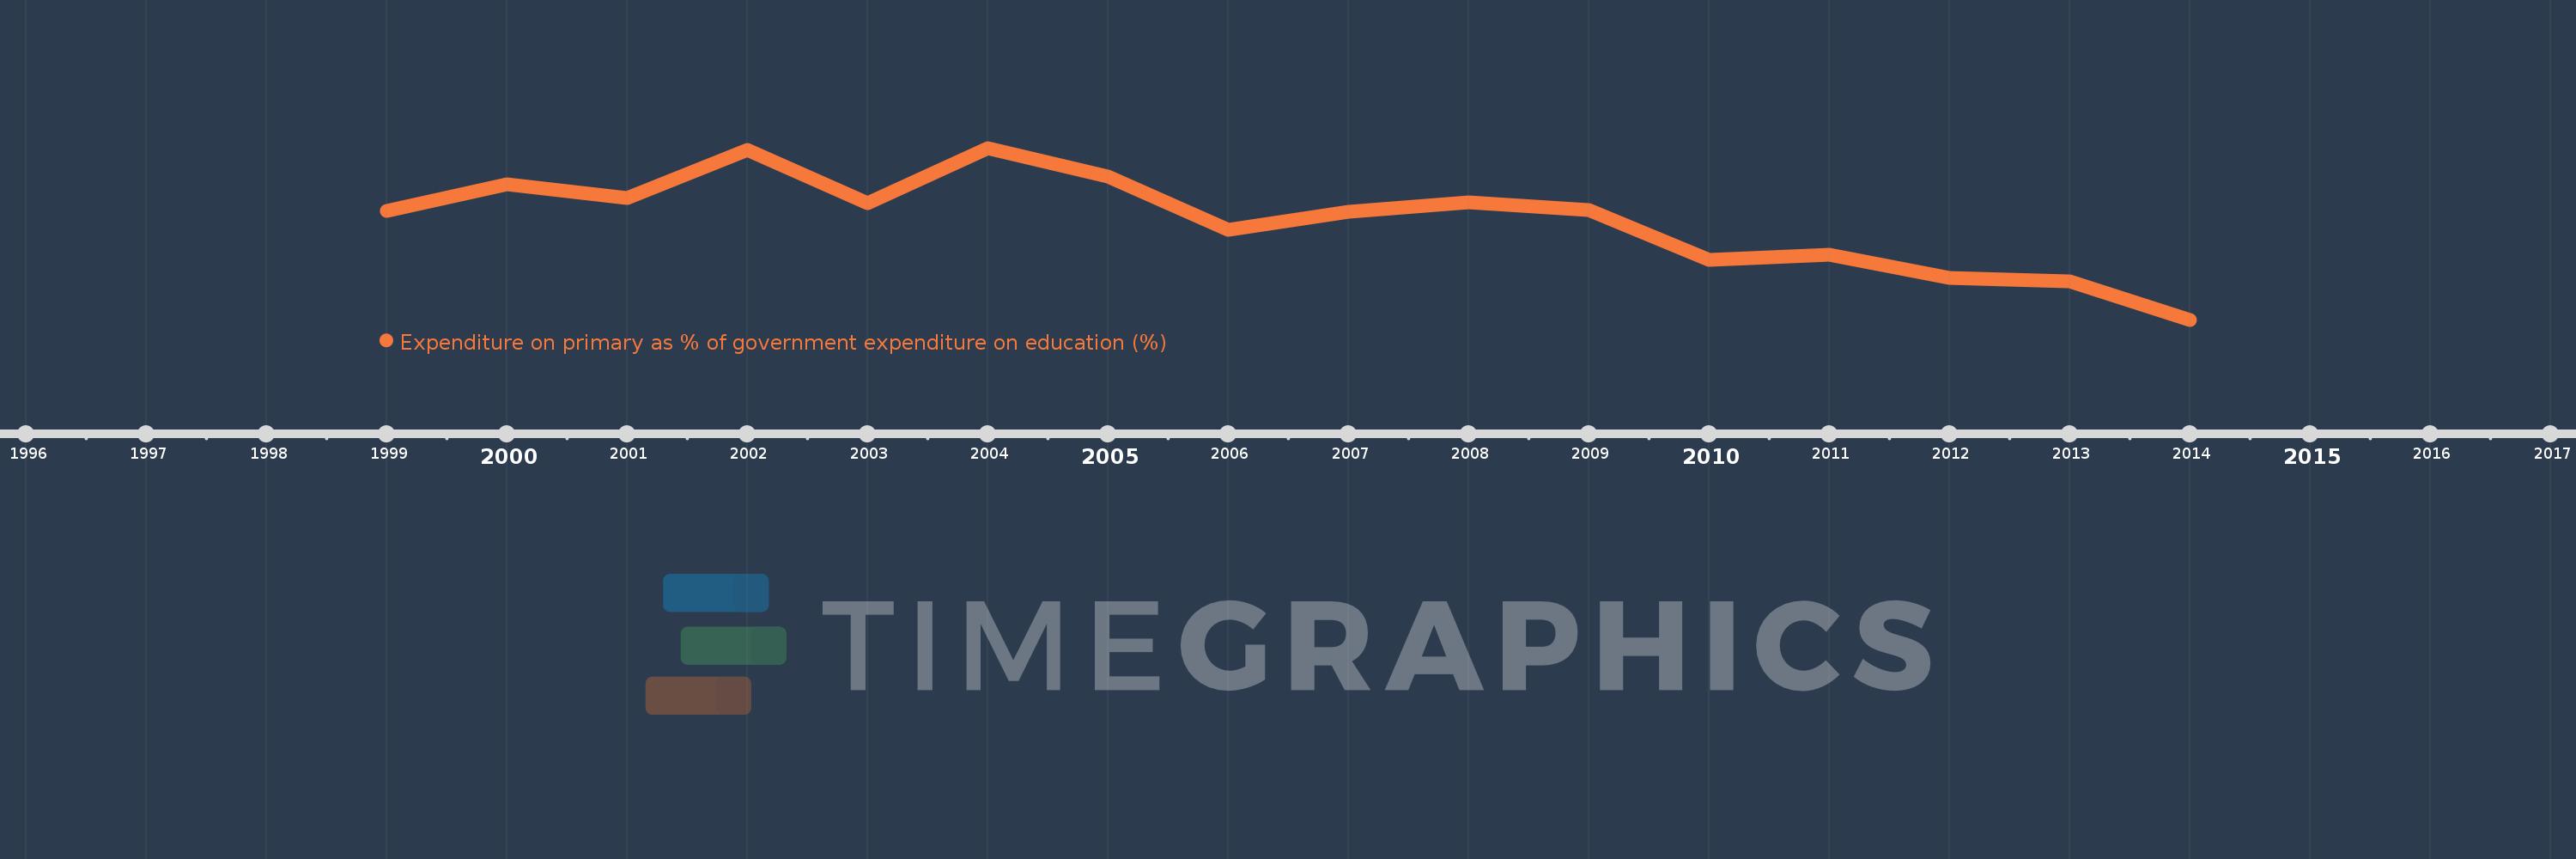
Expenditure on primary as % of government expenditure on education (%)
2014,2013,2012,2011,2010,2009,2008,2007,2006,2005,2004,2003,2002,2001,2000,1999
This statistics in other country:
Timeline:
This timeline shows a graph from 1999 to 2014 of Argentina. No data until 1998. Number of actual observations by date: 16.
Source name:
World Development Indicators
Source organization:
UNESCO Institute for Statistics
Categories, topics:
Education
Last updated:
apr 23, 2017
Indicators value changes by year
Minimum:
30.032
jan 1, 2014
Maximum:
38.015
jan 1, 2004
At the date of observation
Value
Absolute change
Change from previous value
jan 1, 1999
35.07
+35.07
0.0%
jan 1, 2000
36.345
+1.275
3.63%
jan 1, 2001
35.691
-0.654
-1.8%
jan 1, 2002
37.919
+2.228
6.24%
jan 1, 2003
35.434
-2.485
-6.55%
jan 1, 2004
38.015
+2.581
7.28%
jan 1, 2005
36.695
-1.319
-3.47%
jan 1, 2006
34.196
-2.5
-6.81%
jan 1, 2007
35.042
+0.847
2.48%
jan 1, 2008
35.475
+0.433
1.24%
jan 1, 2009
35.113
-0.362
-1.02%
jan 1, 2010
32.803
-2.311
-6.58%
jan 1, 2011
33.055
+0.252
0.77%
jan 1, 2012
31.969
-1.086
-3.29%
jan 1, 2013
31.799
-0.17
-0.53%
jan 1, 2014
30.032
-1.767
-5.56%
Ranking of countries by current statistics by years


Comments: