29
/
en
AIzaSyAYiBZKx7MnpbEhh9jyipgxe19OcubqV5w
April 1, 2024
187708
Malaysia
MYS
true
2
1
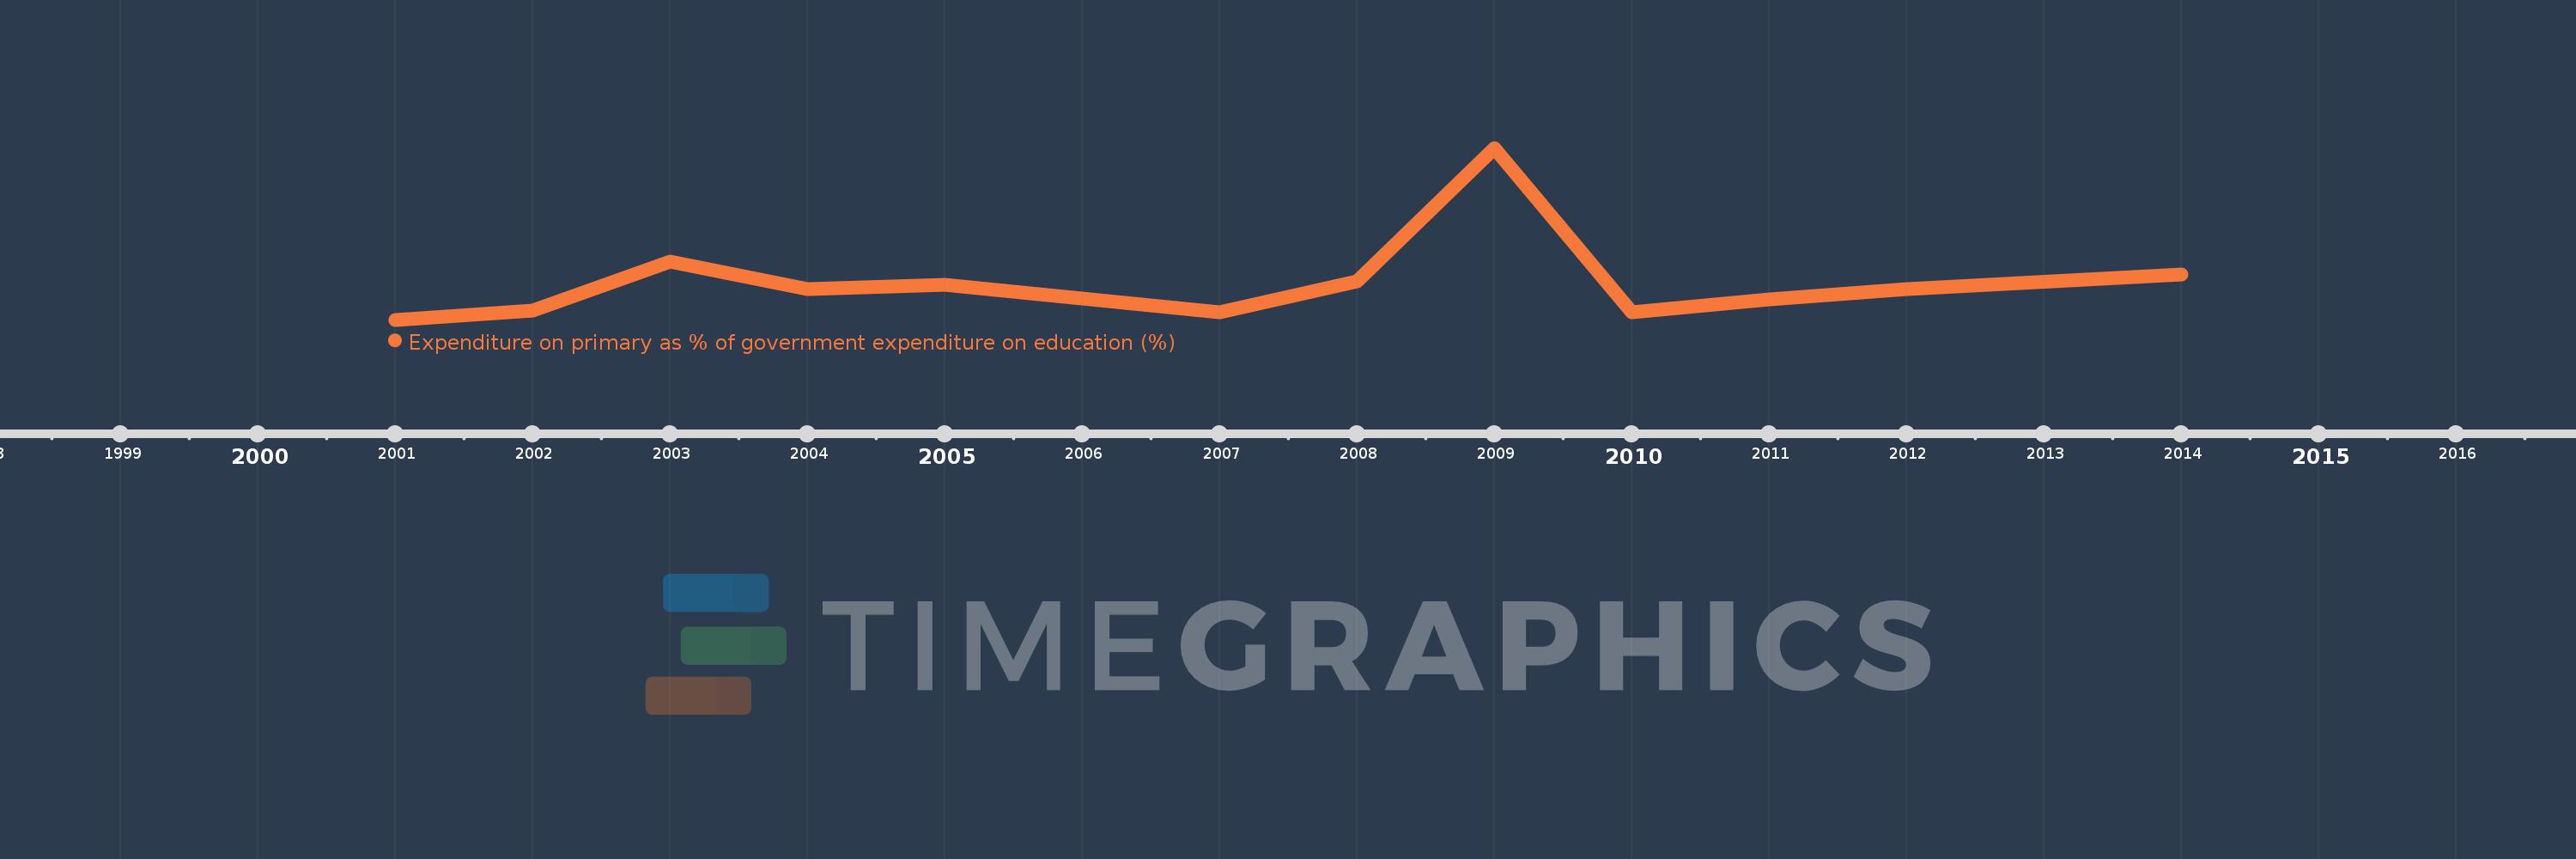
Expenditure on primary as % of government expenditure on education (%)
2014,2012,2011,2010,2009,2008,2007,2005,2004,2003,2002,2001
This statistics in other country:
Timeline:
This timeline shows a graph from 2001 to 2014 of Malaysia. No data until 2000. Number of actual observations by date: 12.
Source name:
World Development Indicators
Source organization:
UNESCO Institute for Statistics
Categories, topics:
Education
Last updated:
apr 23, 2017
Indicators value changes by year
Minimum:
27.168
jan 1, 2001
Maximum:
39.065
jan 1, 2009
At the date of observation
Value
Absolute change
Change from previous value
jan 1, 2001
27.168
+27.168
0.0%
jan 1, 2002
27.798
+0.63
2.32%
jan 1, 2003
31.187
+3.389
12.19%
jan 1, 2004
29.277
-1.91
-6.12%
jan 1, 2005
29.572
+0.295
1.01%
jan 1, 2007
27.707
-1.865
-6.31%
jan 1, 2008
29.825
+2.118
7.64%
jan 1, 2009
39.065
+9.24
30.98%
jan 1, 2010
27.676
-11.388
-29.15%
jan 1, 2011
28.583
+0.906
3.27%
jan 1, 2012
29.271
+0.689
2.41%
jan 1, 2014
30.299
+1.027
3.51%
Ranking of countries by current statistics by years


Comments: