29
/
en
AIzaSyAYiBZKx7MnpbEhh9jyipgxe19OcubqV5w
April 1, 2024
123414
Ecuador
ECU
true
2
1
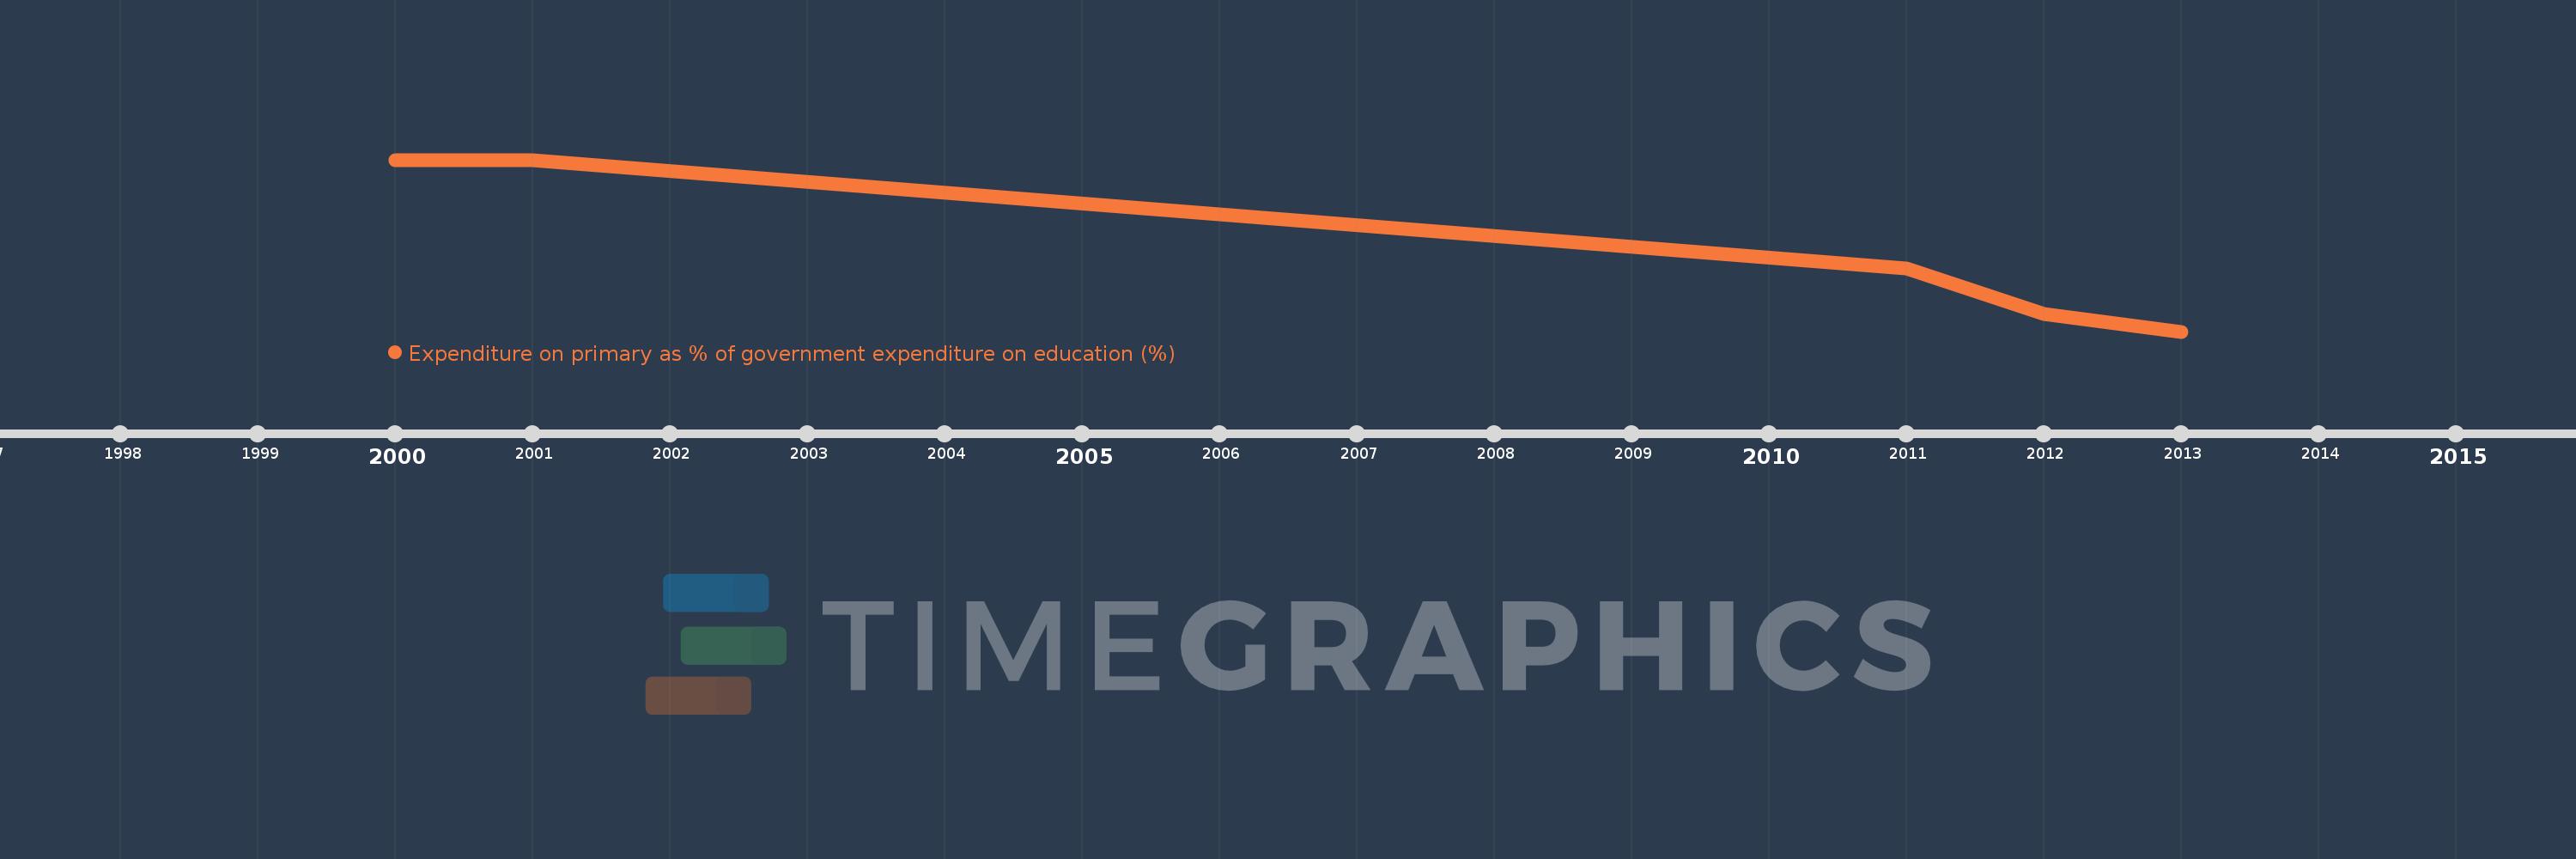
Expenditure on primary as % of government expenditure on education (%)
2013,2012,2011,2001,2000
This statistics in other country:
Timeline:
This timeline shows a graph from 2000 to 2013 of Ecuador. No data until 1999. Number of actual observations by date: 5.
Source name:
World Development Indicators
Source organization:
UNESCO Institute for Statistics
Categories, topics:
Education
Last updated:
apr 23, 2017
Indicators value changes by year
Minimum:
25.417
jan 1, 2013
Maximum:
38.288
jan 1, 2001
At the date of observation
Value
Absolute change
Change from previous value
jan 1, 2000
38.238
+38.238
0.0%
jan 1, 2001
38.288
+0.05
0.13%
jan 1, 2011
30.123
-8.165
-21.33%
jan 1, 2012
26.729
-3.393
-11.27%
jan 1, 2013
25.417
-1.312
-4.91%
Ranking of countries by current statistics by years


Comments: