29
/
en
AIzaSyAYiBZKx7MnpbEhh9jyipgxe19OcubqV5w
April 1, 2024
260813
Tanzania
TZA
true
2
1
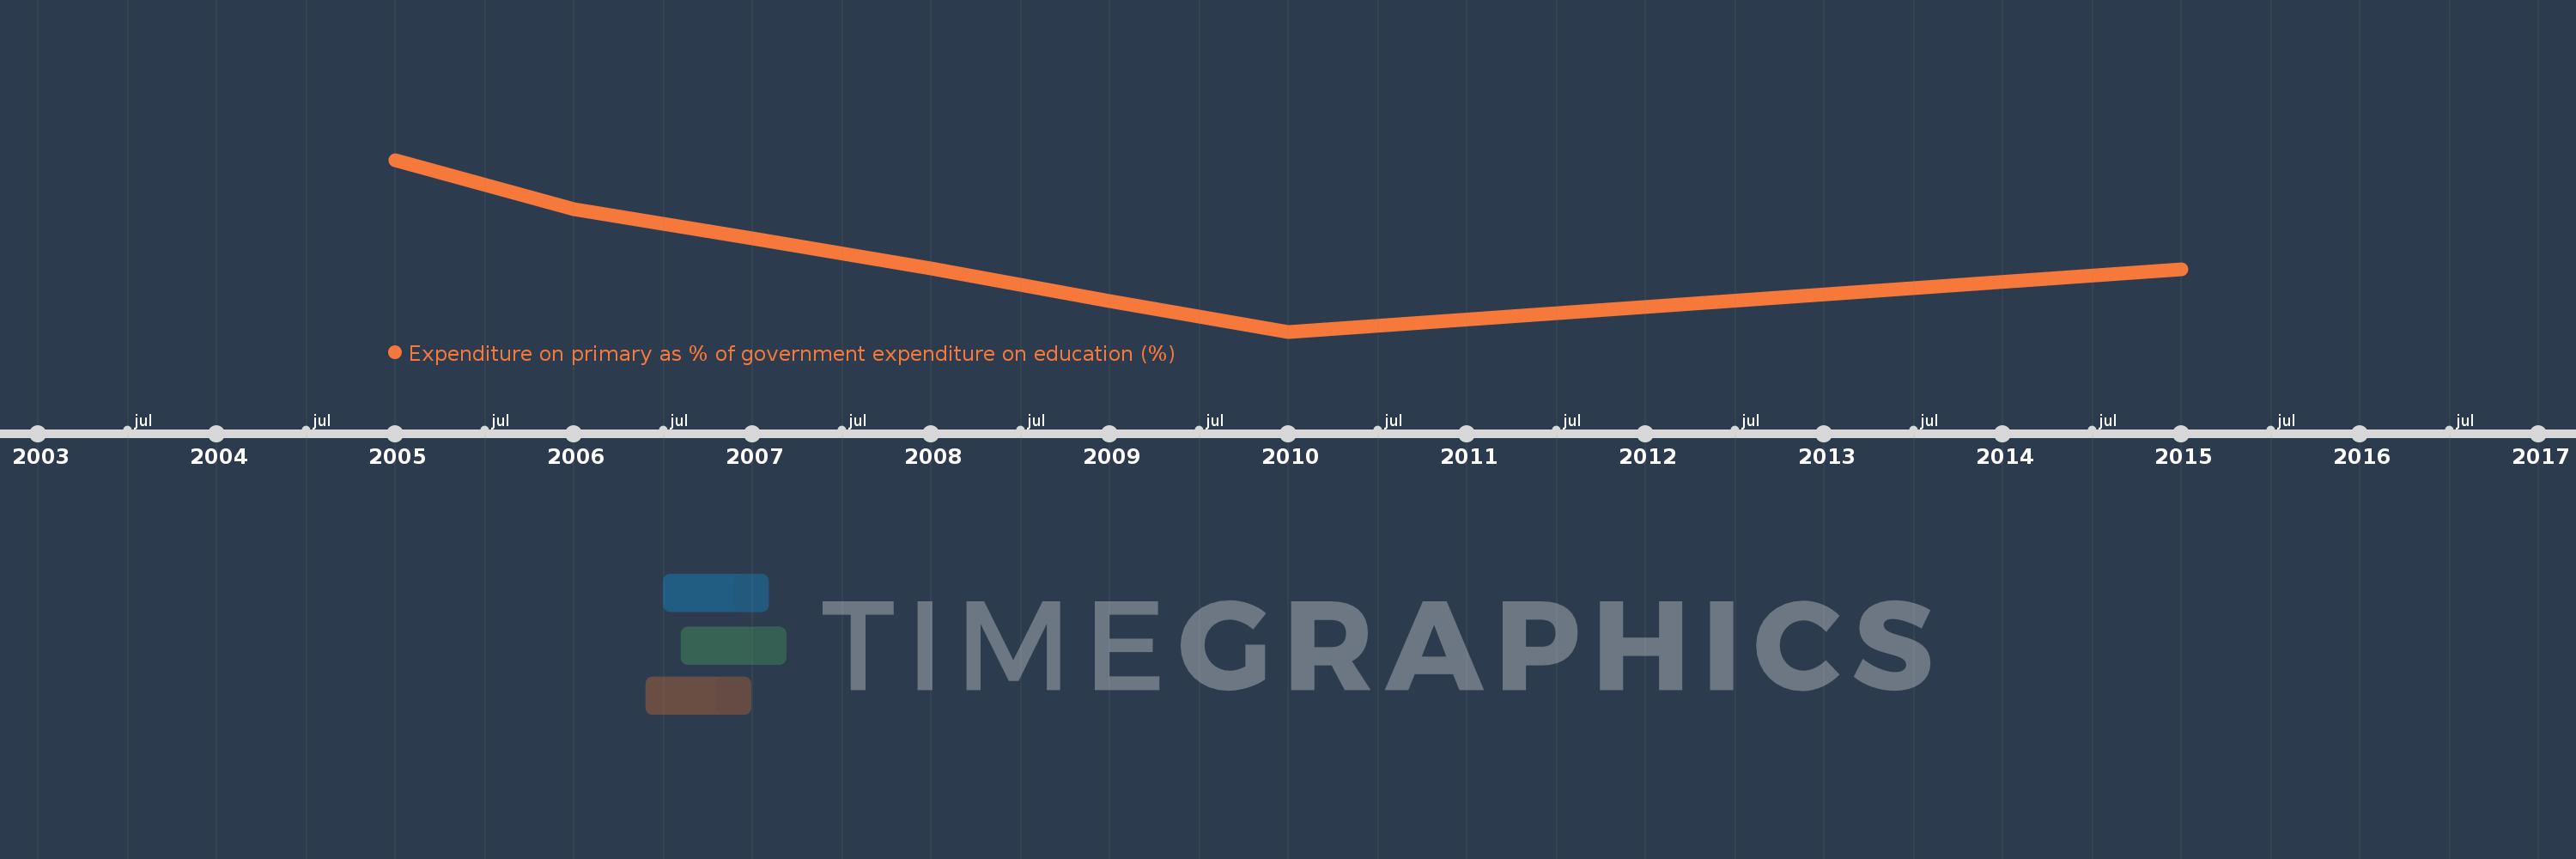
Expenditure on primary as % of government expenditure on education (%)
2015,2010,2009,2008,2007,2006,2005
This statistics in other country:
Timeline:
This timeline shows a graph from 2005 to 2015 of Tanzania. No data until 2004. Number of actual observations by date: 7.
Source name:
World Development Indicators
Source organization:
UNESCO Institute for Statistics
Categories, topics:
Education
Last updated:
apr 23, 2017
Indicators value changes by year
Minimum:
41.906
jan 1, 2010
Maximum:
61.774
jan 1, 2005
At the date of observation
Value
Absolute change
Change from previous value
jan 1, 2005
61.774
+61.774
0.0%
jan 1, 2006
56.023
-5.75
-9.31%
jan 1, 2007
52.676
-3.348
-5.98%
jan 1, 2008
49.169
-3.507
-6.66%
jan 1, 2009
45.432
-3.737
-7.6%
jan 1, 2010
41.906
-3.526
-7.76%
jan 1, 2015
49.15
+7.244
17.29%
Ranking of countries by current statistics by years


Comments: