29
/
en
AIzaSyAYiBZKx7MnpbEhh9jyipgxe19OcubqV5w
April 1, 2024
103531
Chad
TCD
true
2
1
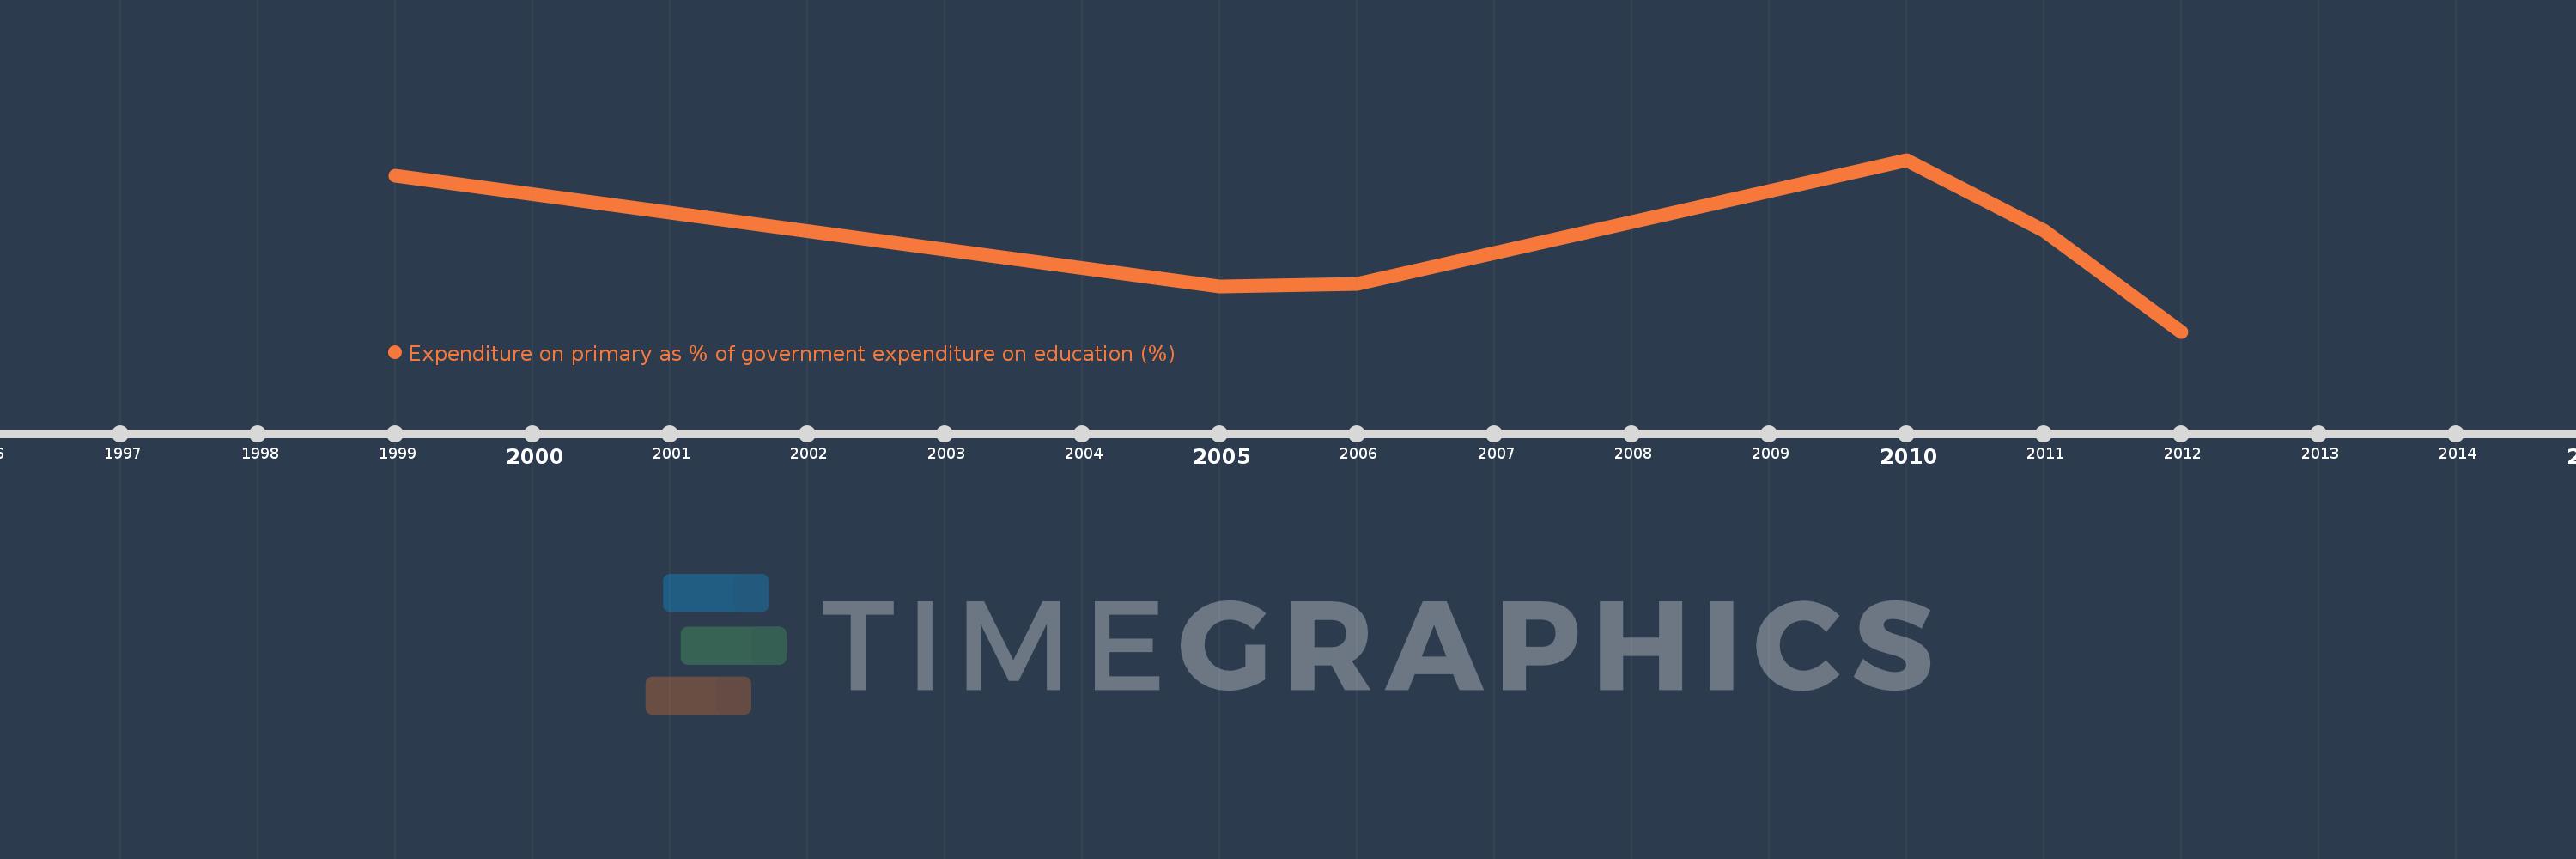
Expenditure on primary as % of government expenditure on education (%)
2012,2011,2010,2006,2005,1999
This statistics in other country:
Timeline:
This timeline shows a graph from 1999 to 2012 of Chad. No data until 1998. Number of actual observations by date: 6.
Source name:
World Development Indicators
Source organization:
UNESCO Institute for Statistics
Categories, topics:
Education
Last updated:
apr 23, 2017
Indicators value changes by year
Minimum:
40.667
jan 1, 2012
Maximum:
59.241
jan 1, 2010
At the date of observation
Value
Absolute change
Change from previous value
jan 1, 1999
57.5
+57.5
0.0%
jan 1, 2005
45.558
-11.942
-20.77%
jan 1, 2006
45.785
+0.227
0.5%
jan 1, 2010
59.241
+13.456
29.39%
jan 1, 2011
51.619
-7.622
-12.87%
jan 1, 2012
40.667
-10.953
-21.22%
Ranking of countries by current statistics by years


Comments: