29
/
en
AIzaSyAYiBZKx7MnpbEhh9jyipgxe19OcubqV5w
April 1, 2024
199058
Mongolia
MNG
true
2
1
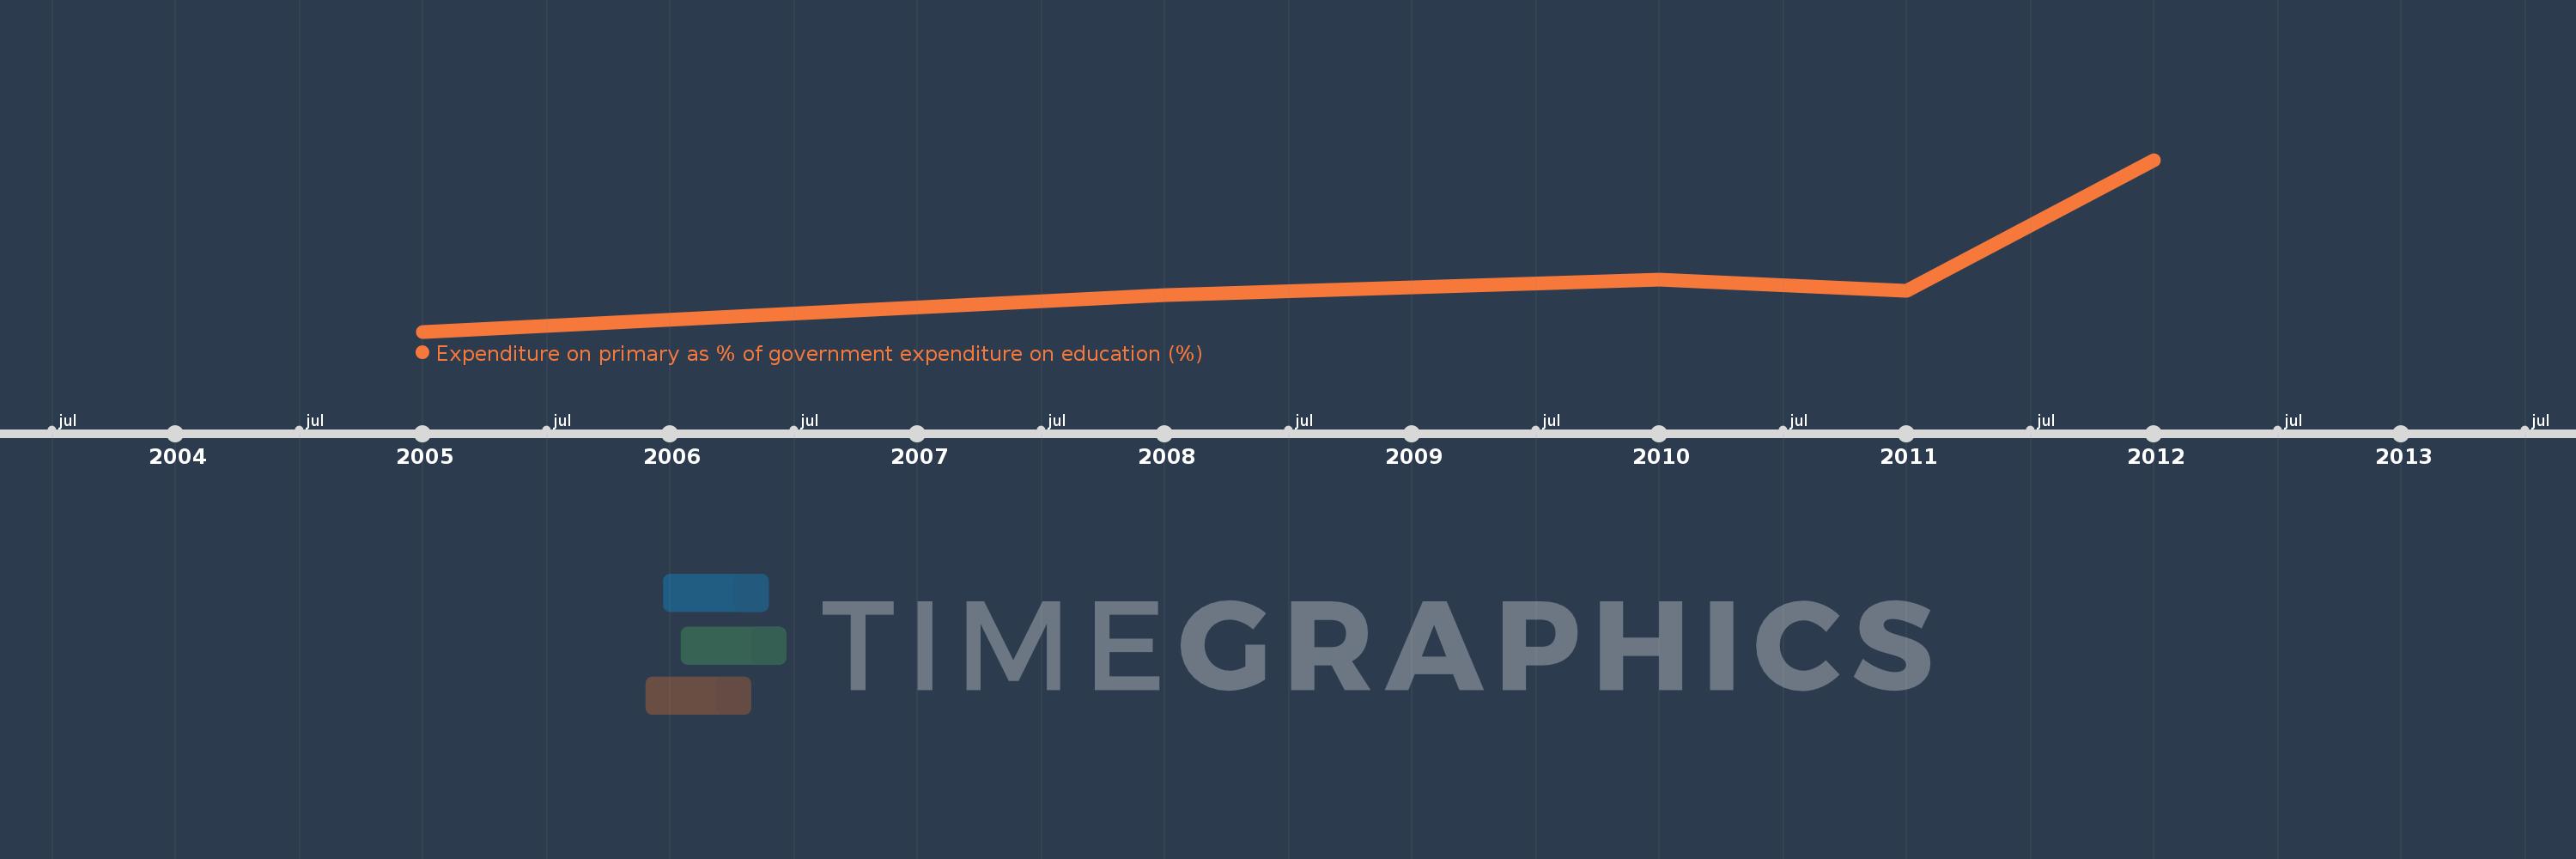
Expenditure on primary as % of government expenditure on education (%)
2012,2011,2010,2008,2005
This statistics in other country:
Timeline:
This timeline shows a graph from 2005 to 2012 of Mongolia. No data until 2004. Number of actual observations by date: 5.
Source name:
World Development Indicators
Source organization:
UNESCO Institute for Statistics
Categories, topics:
Education
Last updated:
apr 23, 2017
Indicators value changes by year
Minimum:
25.068
jan 1, 2005
Maximum:
32.736
jan 1, 2012
At the date of observation
Value
Absolute change
Change from previous value
jan 1, 2005
25.068
+25.068
0.0%
jan 1, 2008
26.714
+1.646
6.57%
jan 1, 2010
27.379
+0.665
2.49%
jan 1, 2011
26.896
-0.483
-1.77%
jan 1, 2012
32.736
+5.84
21.71%
Ranking of countries by current statistics by years


Comments: