29
/
en
AIzaSyAYiBZKx7MnpbEhh9jyipgxe19OcubqV5w
April 1, 2024
107162
Colombia
COL
true
2
1
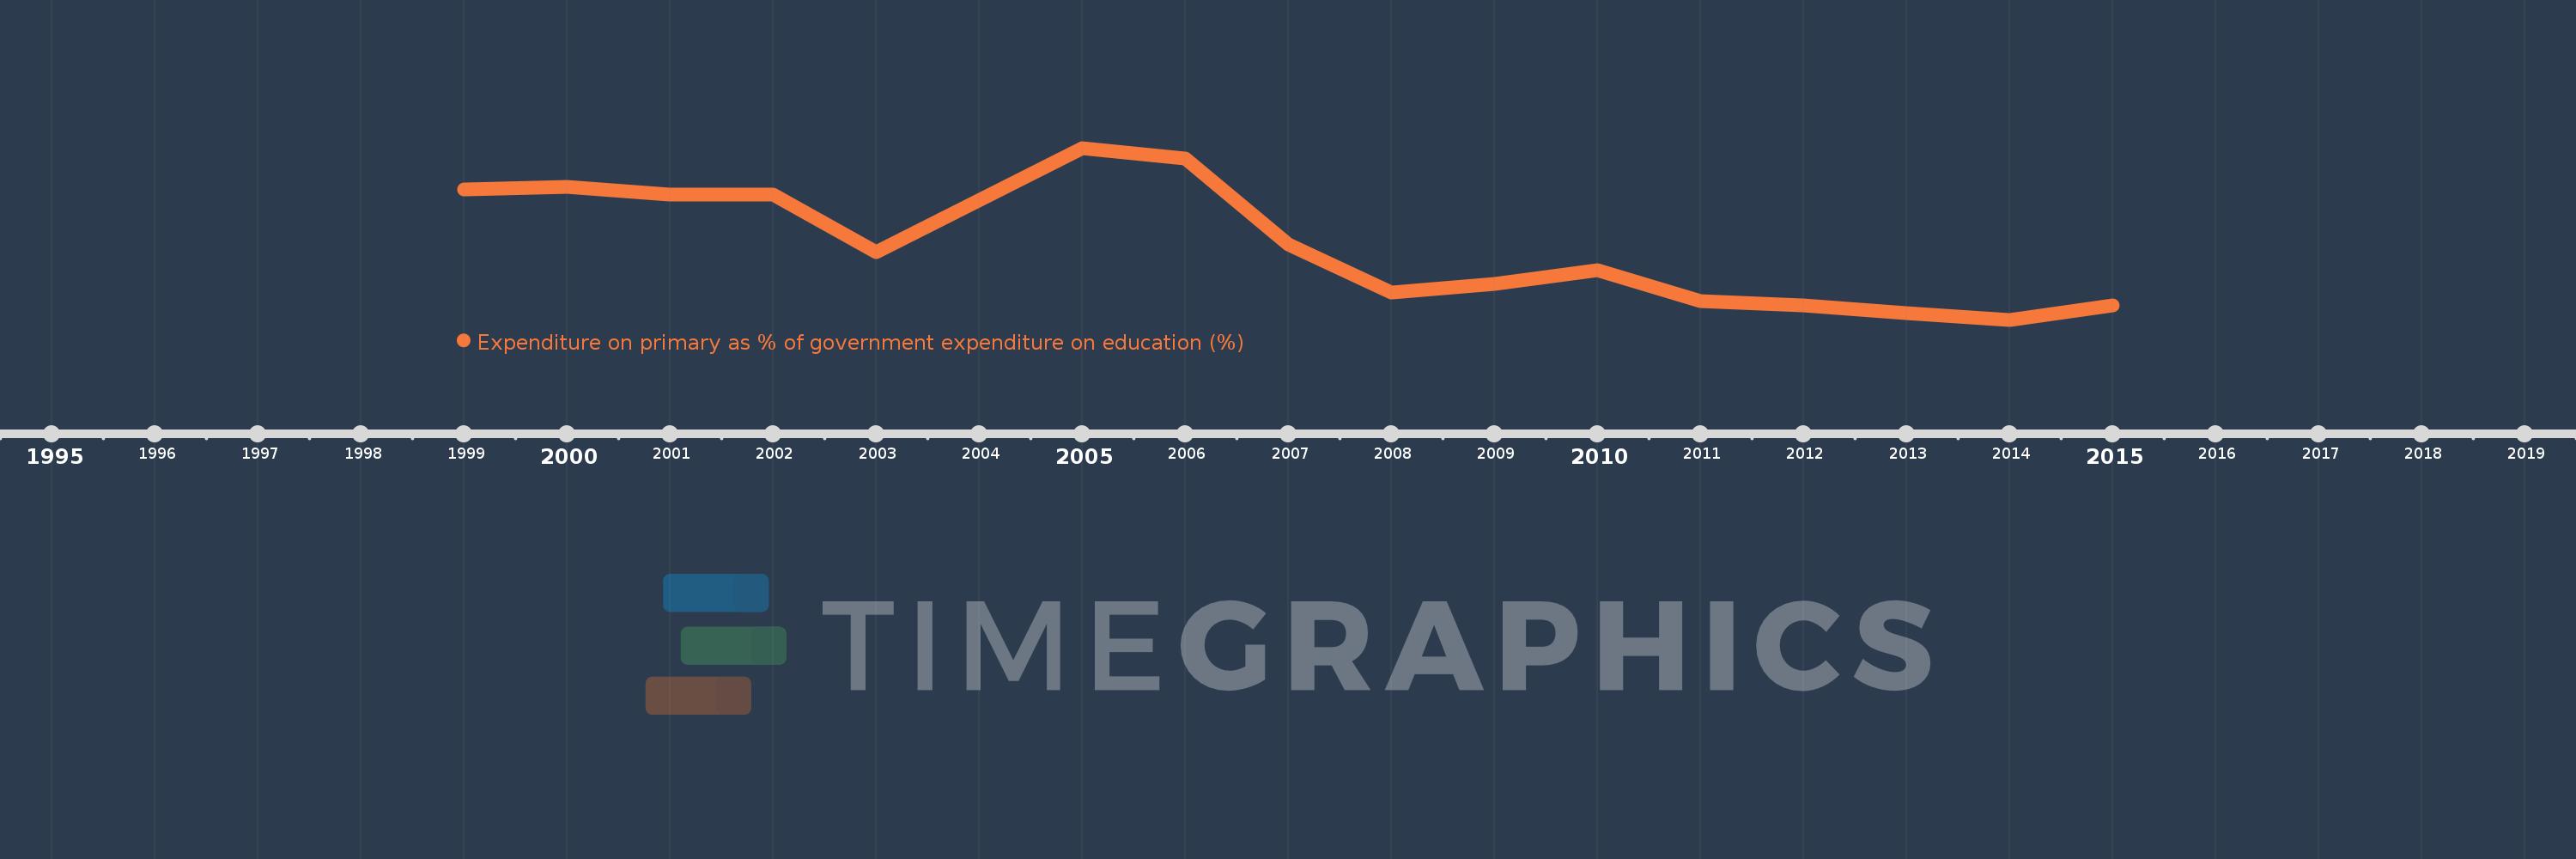
Expenditure on primary as % of government expenditure on education (%)
2015,2014,2013,2012,2011,2010,2009,2008,2007,2006,2005,2003,2002,2001,2000,1999
This statistics in other country:
Timeline:
This timeline shows a graph from 1999 to 2015 of Colombia. No data until 1998. Number of actual observations by date: 16.
Source name:
World Development Indicators
Source organization:
UNESCO Institute for Statistics
Categories, topics:
Education
Last updated:
apr 23, 2017
Indicators value changes by year
Maximum:
48.325
jan 1, 2005
At the date of observation
Value
Absolute change
Change from previous value
jan 1, 1999
44.938
+44.938
0.0%
jan 1, 2000
45.162
+0.224
0.5%
jan 1, 2001
44.557
-0.605
-1.34%
jan 1, 2002
44.572
+0.015
0.03%
jan 1, 2003
39.882
-4.69
-10.52%
jan 1, 2005
48.325
+8.443
21.17%
jan 1, 2006
47.437
-0.888
-1.84%
jan 1, 2007
40.497
-6.94
-14.63%
jan 1, 2008
36.628
-3.869
-9.55%
jan 1, 2009
37.303
+0.675
1.84%
jan 1, 2010
38.407
+1.105
2.96%
jan 1, 2011
35.922
-2.486
-6.47%
jan 1, 2012
35.577
-0.345
-0.96%
jan 1, 2013
34.964
-0.613
-1.72%
jan 1, 2014
34.42
-0.544
-1.56%
jan 1, 2015
35.6
+1.18
3.43%
Ranking of countries by current statistics by years


Comments: