29
/
en
AIzaSyAYiBZKx7MnpbEhh9jyipgxe19OcubqV5w
April 1, 2024
112166
Costa Rica
CRI
true
2
1
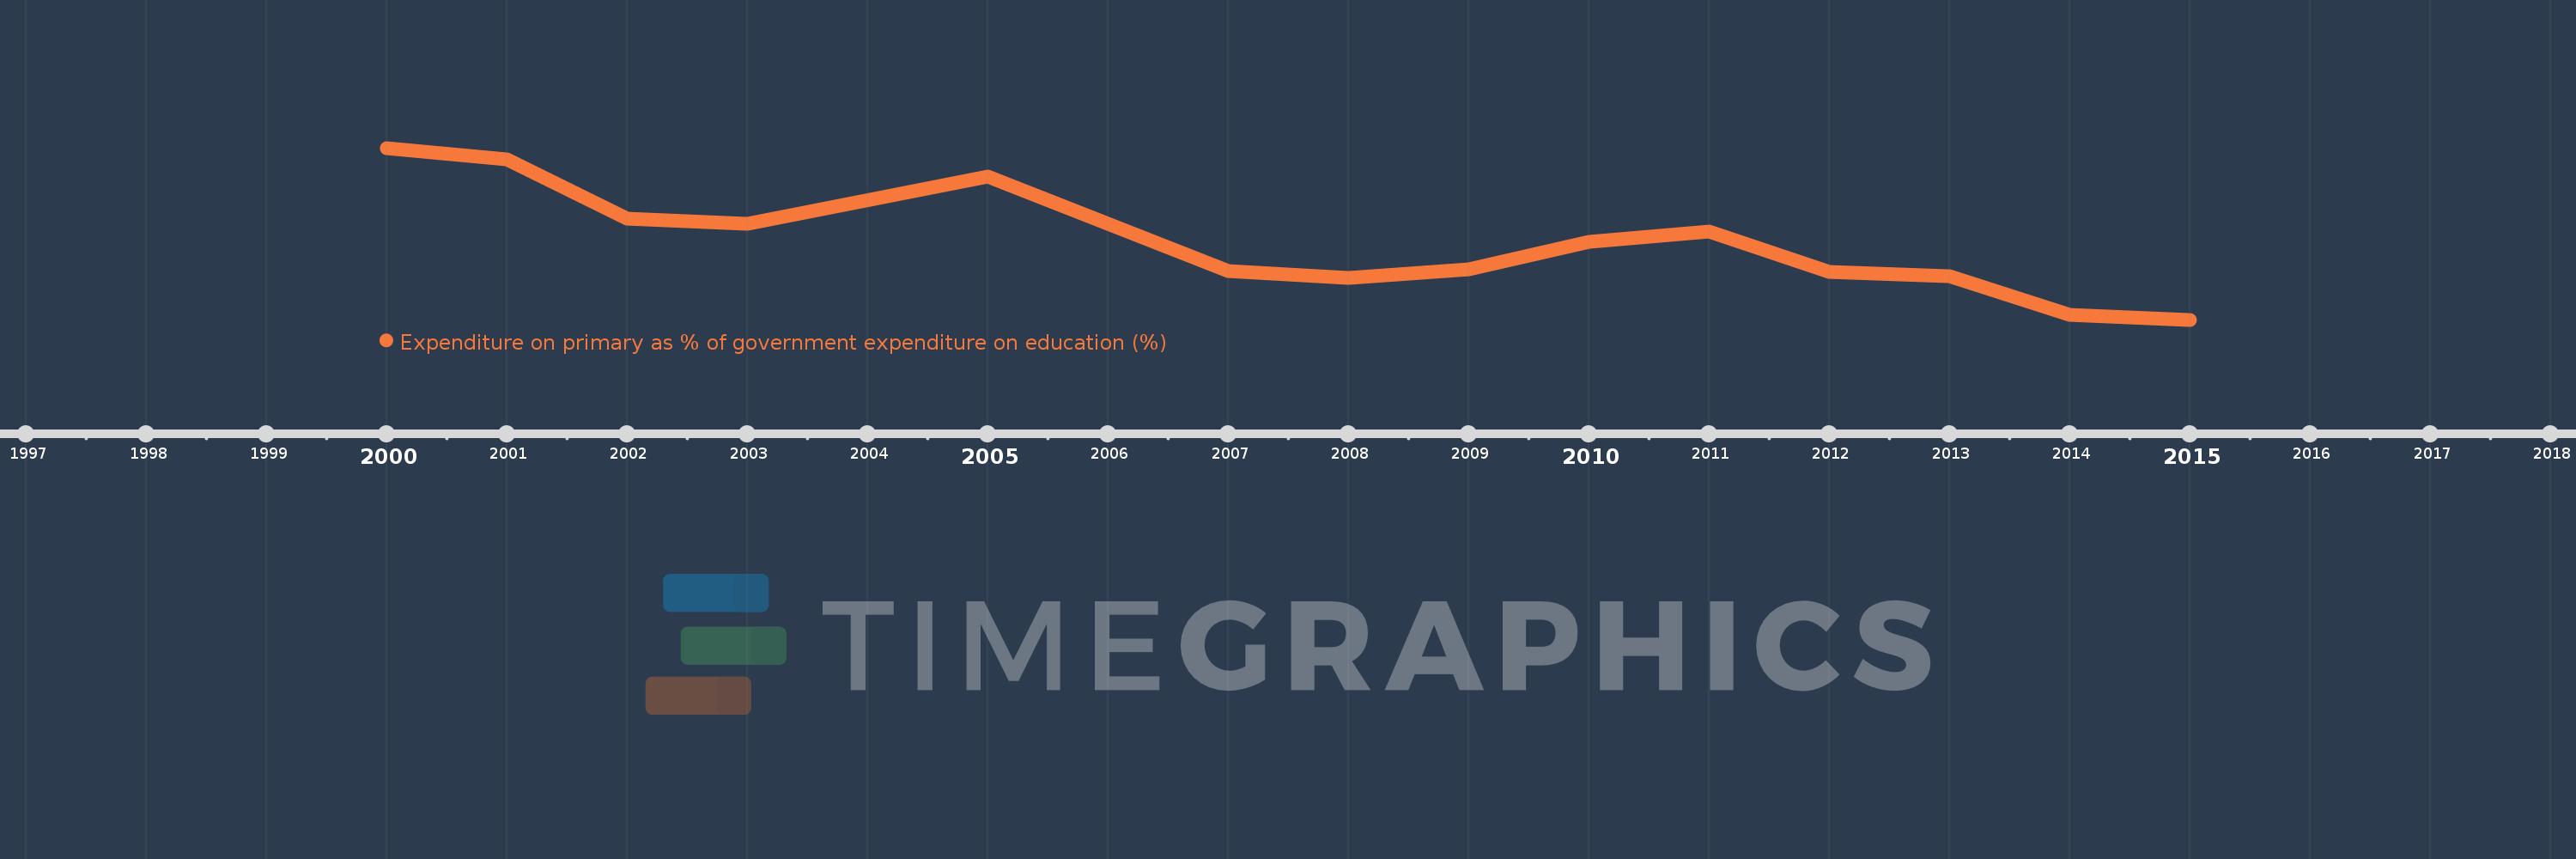
Expenditure on primary as % of government expenditure on education (%)
2015,2014,2013,2012,2011,2010,2009,2008,2007,2005,2003,2002,2001,2000
This statistics in other country:
Timeline:
This timeline shows a graph from 2000 to 2015 of Costa Rica. No data until 1999. Number of actual observations by date: 14.
Source name:
World Development Indicators
Source organization:
UNESCO Institute for Statistics
Categories, topics:
Education
Last updated:
apr 23, 2017
Indicators value changes by year
Minimum:
36.309
jan 1, 2015
Maximum:
47.254
jan 1, 2000
At the date of observation
Value
Absolute change
Change from previous value
jan 1, 2000
47.254
+47.254
0.0%
jan 1, 2001
46.527
-0.727
-1.54%
jan 1, 2002
42.757
-3.77
-8.1%
jan 1, 2003
42.41
-0.346
-0.81%
jan 1, 2005
45.458
+3.048
7.19%
jan 1, 2007
39.421
-6.038
-13.28%
jan 1, 2008
38.975
-0.445
-1.13%
jan 1, 2009
39.534
+0.559
1.43%
jan 1, 2010
41.247
+1.712
4.33%
jan 1, 2011
41.904
+0.657
1.59%
jan 1, 2012
39.333
-2.571
-6.13%
jan 1, 2013
39.102
-0.231
-0.59%
jan 1, 2014
36.597
-2.505
-6.41%
jan 1, 2015
36.309
-0.289
-0.79%
Ranking of countries by current statistics by years


Comments: