29
/
en
AIzaSyAYiBZKx7MnpbEhh9jyipgxe19OcubqV5w
April 1, 2024
29808
Euro area
EMU
false
2
1
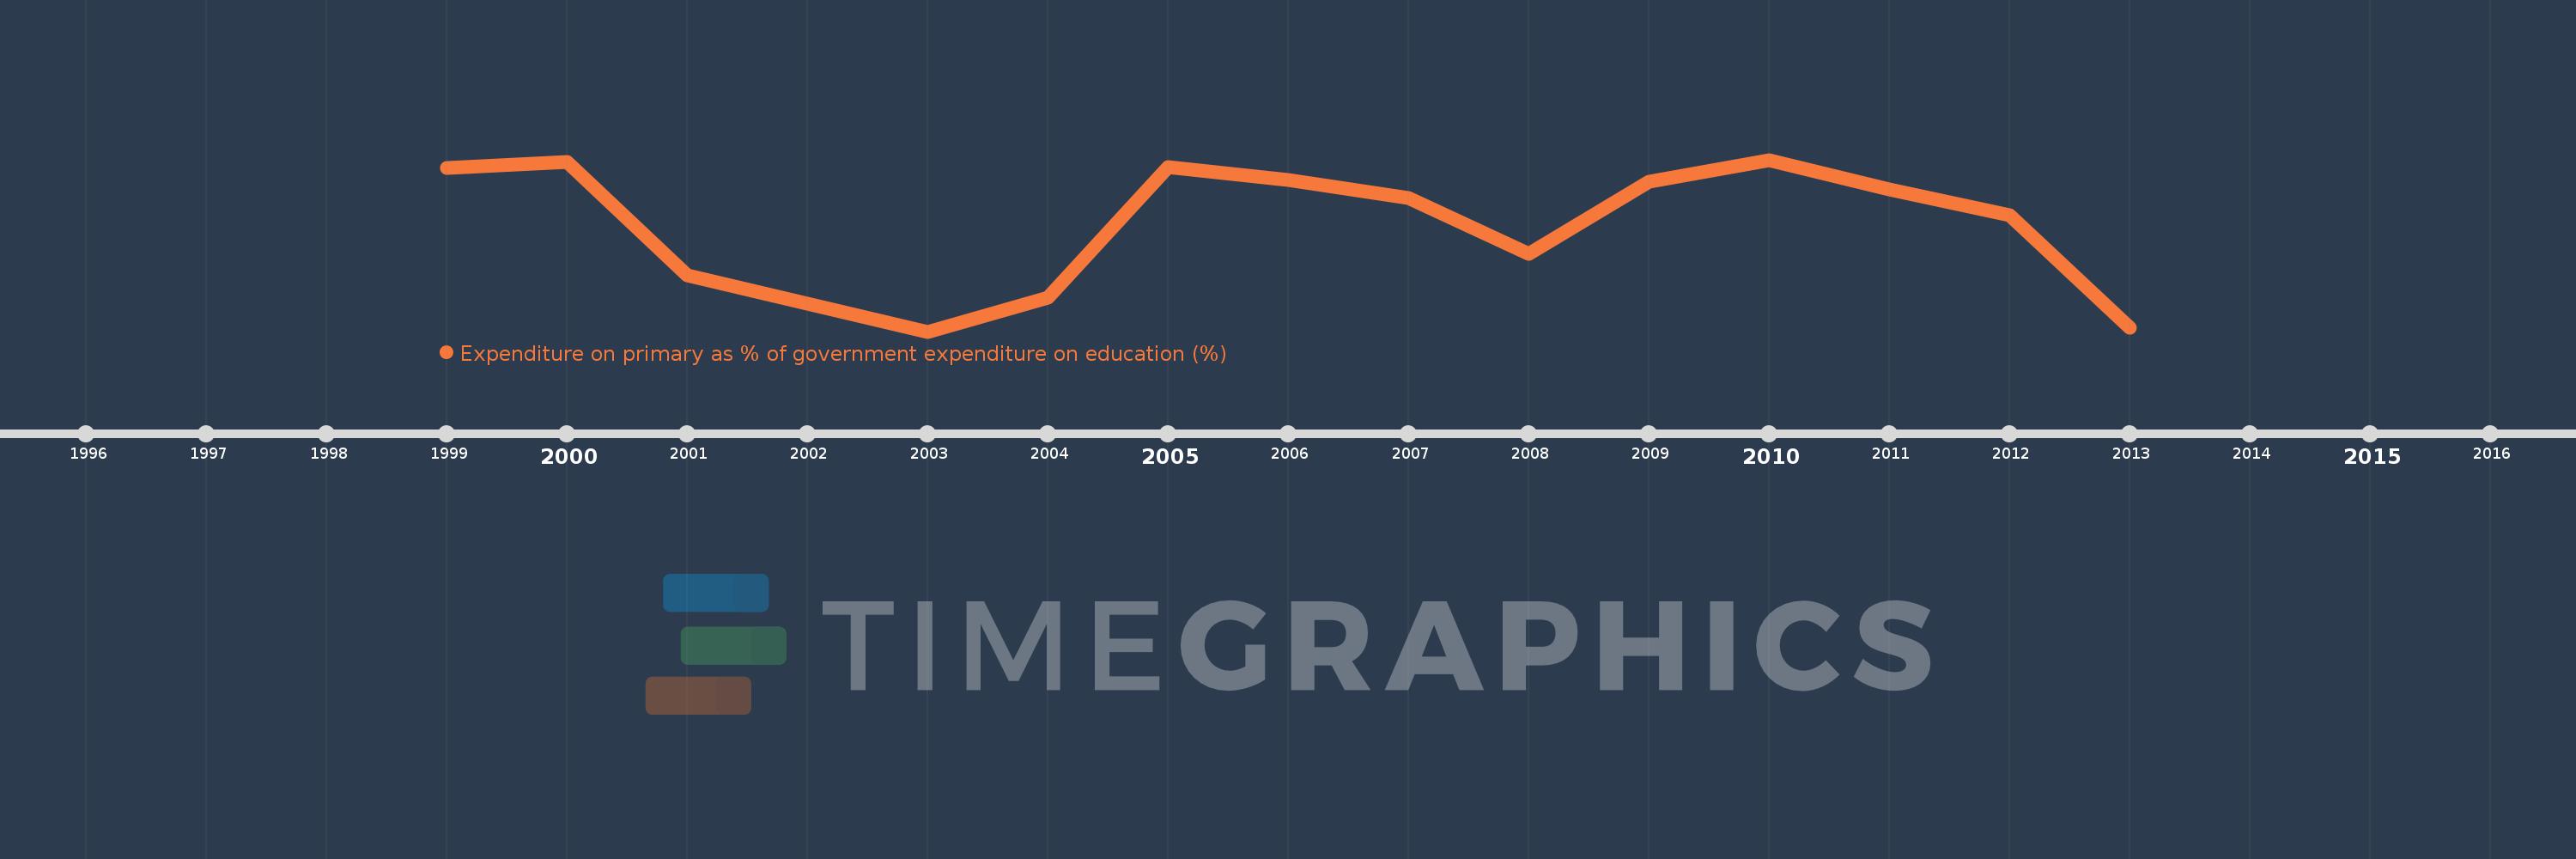
Expenditure on primary as % of government expenditure on education (%)
2013,2012,2011,2010,2009,2008,2007,2006,2005,2004,2003,2002,2001,2000,1999
This statistics in other country:
Timeline:
This timeline shows a graph from 1999 to 2013 of Euro area. No data until 1998. Number of actual observations by date: 15.
Source name:
World Development Indicators
Source organization:
UNESCO Institute for Statistics
Categories, topics:
Education
Last updated:
apr 23, 2017
Indicators value changes by year
Minimum:
22.397
jan 1, 2003
Maximum:
24.866
jan 1, 2010
At the date of observation
Value
Absolute change
Change from previous value
jan 1, 1999
24.747
+24.747
0.0%
jan 1, 2000
24.837
+0.09
0.36%
jan 1, 2001
23.204
-1.633
-6.57%
jan 1, 2002
22.8
-0.404
-1.74%
jan 1, 2003
22.397
-0.404
-1.77%
jan 1, 2004
22.883
+0.487
2.17%
jan 1, 2005
24.757
+1.874
8.19%
jan 1, 2006
24.579
-0.177
-0.72%
jan 1, 2007
24.32
-0.26
-1.06%
jan 1, 2008
23.516
-0.804
-3.31%
jan 1, 2009
24.557
+1.041
4.43%
jan 1, 2010
24.866
+0.308
1.26%
jan 1, 2011
24.446
-0.42
-1.69%
jan 1, 2012
24.07
-0.376
-1.54%
jan 1, 2013
22.452
-1.618
-6.72%
Ranking of countries by current statistics by years


Comments: