29
/
en
AIzaSyAYiBZKx7MnpbEhh9jyipgxe19OcubqV5w
April 1, 2024
211627
Niger
NER
true
2
1
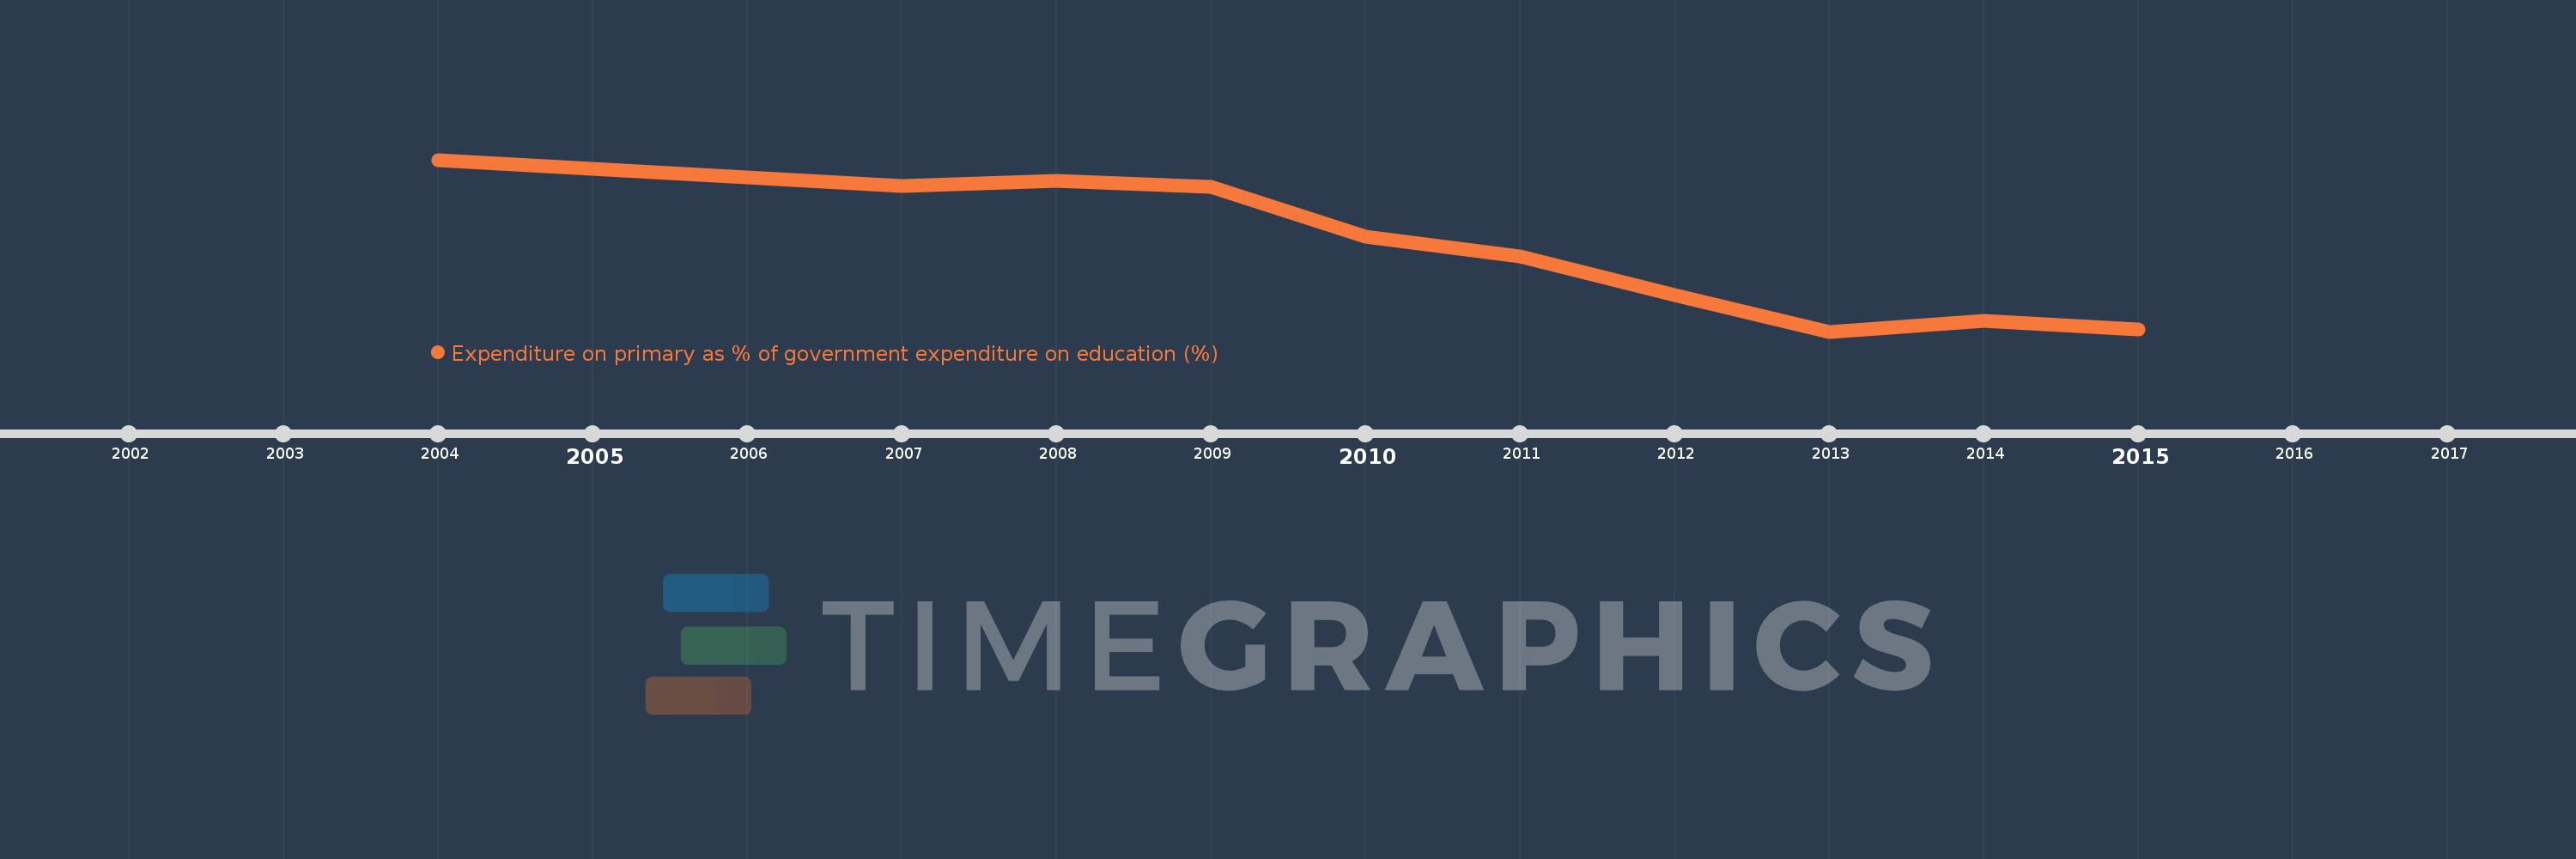
Expenditure on primary as % of government expenditure on education (%)
2015,2014,2013,2012,2011,2010,2009,2008,2007,2004
This statistics in other country:
Timeline:
This timeline shows a graph from 2004 to 2015 of Niger. No data until 2003. Number of actual observations by date: 10.
Source name:
World Development Indicators
Source organization:
UNESCO Institute for Statistics
Categories, topics:
Education
Last updated:
apr 23, 2017
Indicators value changes by year
Minimum:
51.942
jan 1, 2013
Maximum:
72.645
jan 1, 2004
At the date of observation
Value
Absolute change
Change from previous value
jan 1, 2004
72.645
+72.645
0.0%
jan 1, 2007
69.485
-3.16
-4.35%
jan 1, 2008
70.095
+0.61
0.88%
jan 1, 2009
69.342
-0.753
-1.07%
jan 1, 2010
63.411
-5.931
-8.55%
jan 1, 2011
60.978
-2.433
-3.84%
jan 1, 2012
56.363
-4.615
-7.57%
jan 1, 2013
51.942
-4.421
-7.84%
jan 1, 2014
53.259
+1.318
2.54%
jan 1, 2015
52.186
-1.073
-2.01%
Ranking of countries by current statistics by years


Comments: