29
/
en
AIzaSyAYiBZKx7MnpbEhh9jyipgxe19OcubqV5w
April 1, 2024
161404
Italy
ITA
true
2
1
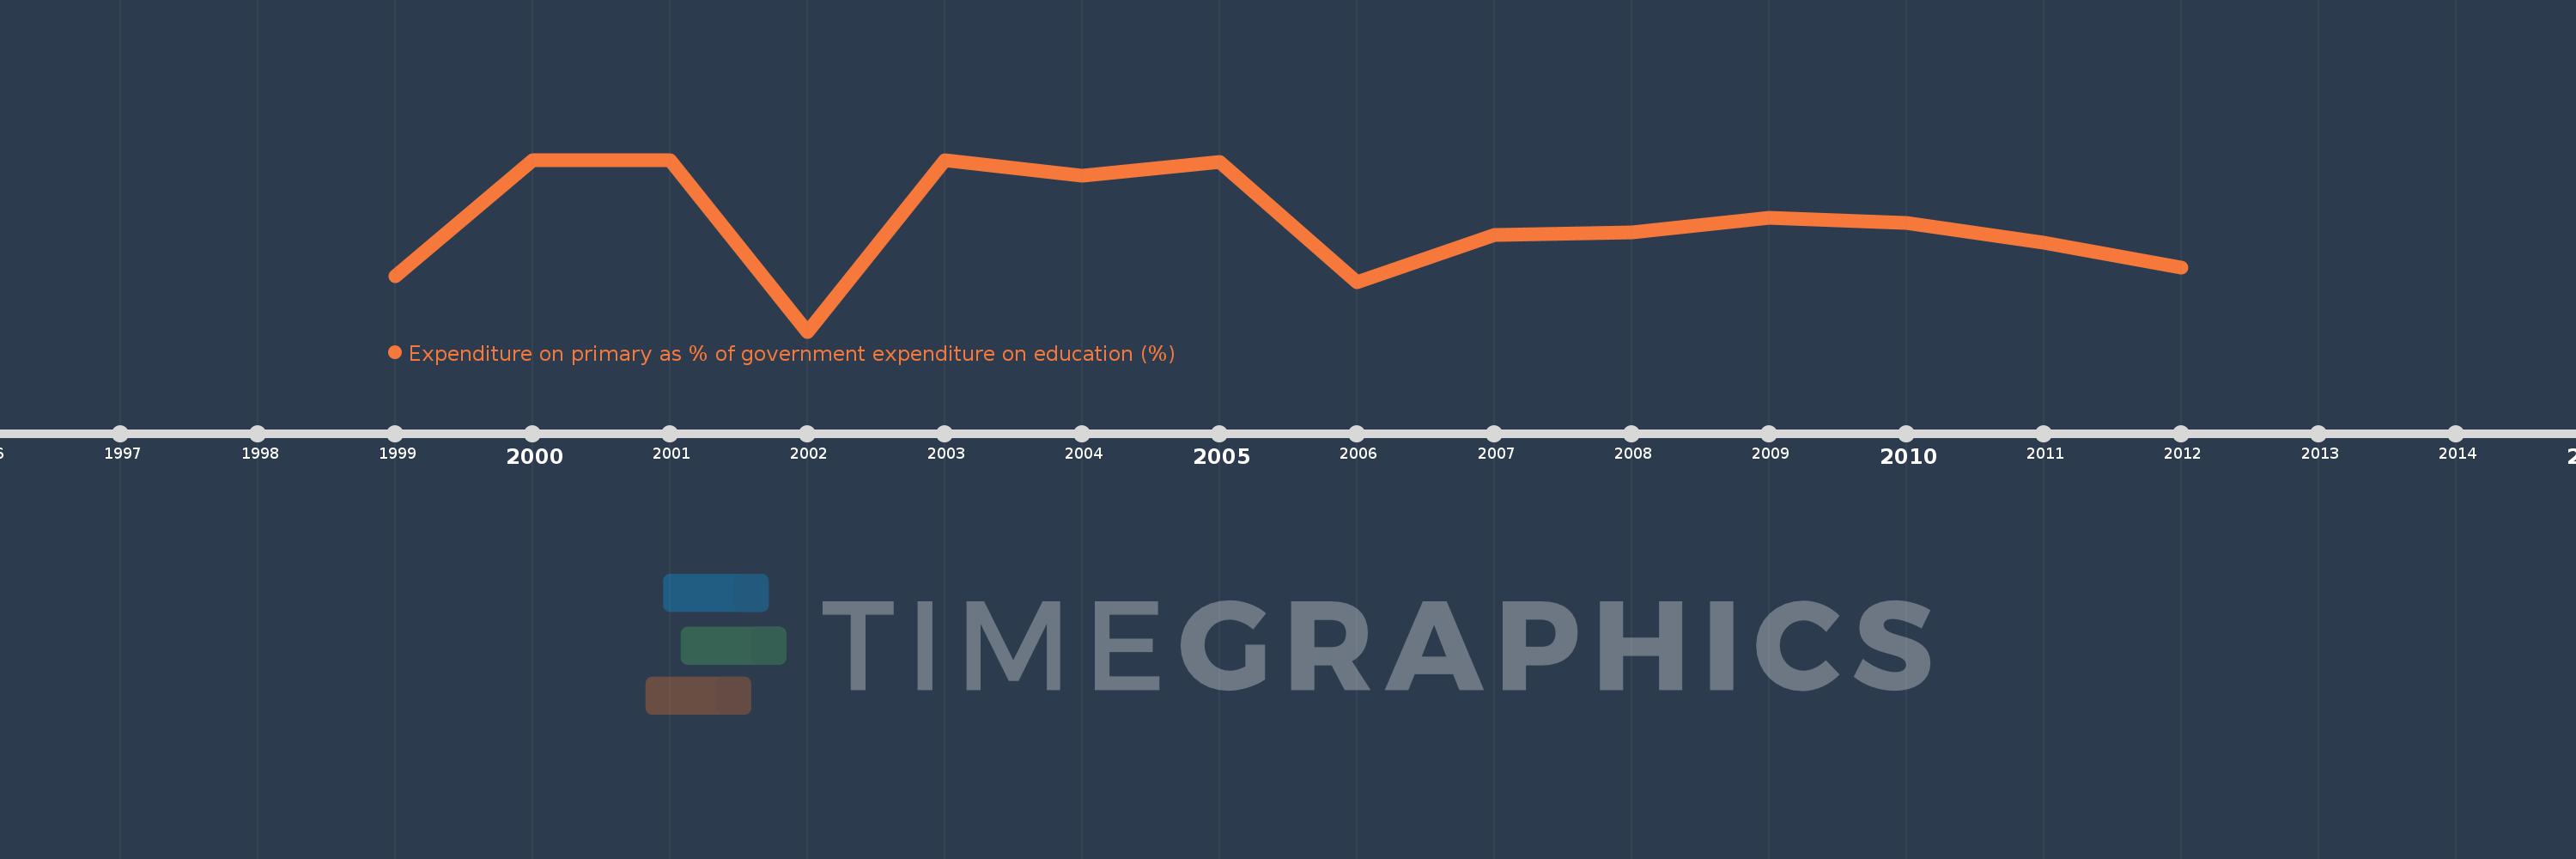
Expenditure on primary as % of government expenditure on education (%)
2012,2011,2010,2009,2008,2007,2006,2005,2004,2003,2002,2001,2000,1999
This statistics in other country:
Timeline:
This timeline shows a graph from 1999 to 2012 of Italy. No data until 1998. Number of actual observations by date: 14.
Source name:
World Development Indicators
Source organization:
UNESCO Institute for Statistics
Categories, topics:
Education
Last updated:
apr 23, 2017
Indicators value changes by year
Minimum:
24.079
jan 1, 2002
Maximum:
25.818
jan 1, 2000
At the date of observation
Value
Absolute change
Change from previous value
jan 1, 1999
24.636
+24.636
0.0%
jan 1, 2000
25.818
+1.183
4.8%
jan 1, 2001
25.818
0.0
0.0%
jan 1, 2002
24.079
-1.74
-6.74%
jan 1, 2003
25.818
+1.74
7.23%
jan 1, 2004
25.654
-0.164
-0.64%
jan 1, 2005
25.799
+0.145
0.57%
jan 1, 2006
24.579
-1.22
-4.73%
jan 1, 2007
25.056
+0.476
1.94%
jan 1, 2008
25.085
+0.029
0.11%
jan 1, 2009
25.231
+0.147
0.59%
jan 1, 2010
25.179
-0.052
-0.21%
jan 1, 2011
24.978
-0.201
-0.8%
jan 1, 2012
24.727
-0.251
-1.01%
Ranking of countries by current statistics by years


Comments: