29
/fr/
fr
AIzaSyAYiBZKx7MnpbEhh9jyipgxe19OcubqV5w
April 1, 2024
81684
Belgium
BEL
true
2
1
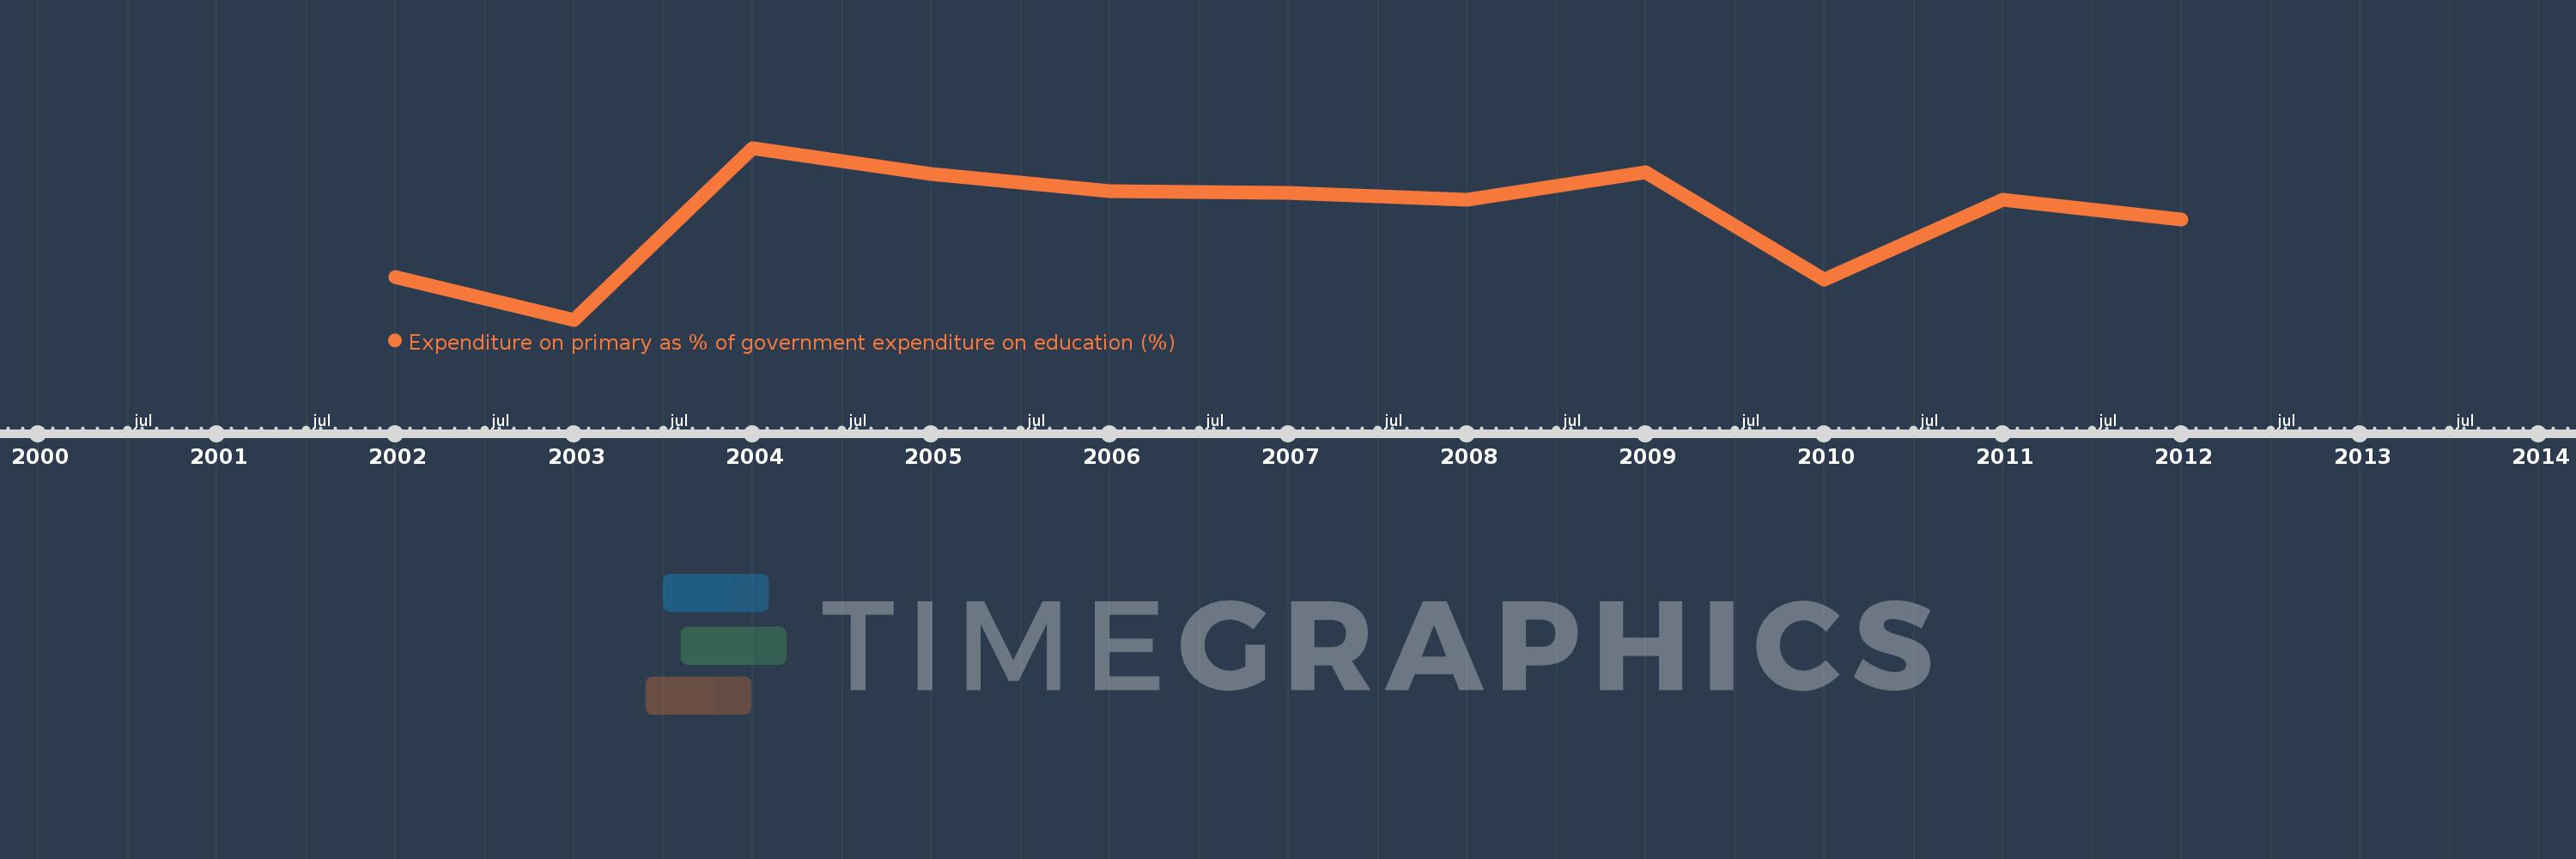
Expenditure on primary as % of government expenditure on education (%)
2012,2011,2010,2009,2008,2007,2006,2005,2004,2003,2002
Cette statistique dans les autres pays:
La ligne de temps
Cette échelle de temps montre un graphique de 2002 année à 2012 année Belgium. Les données jusqu'à 2001 année ne sont pas présentés. Quantité d'observations actuelles selon dates: 11.
Source (désignation):
Les indicateurs du développement mondiale
Source (organisation):
UNESCO Institute for Statistics
Catégories:
Education
Dernière mise à jour
23 avr. 2017
Les indicateurs de changement de valeurs selon les années
Minimum:
22.397
1 janv. 2003
Maximum:
24.003
1 janv. 2004
Pour la date d''observation
Valeur
Changement absolu
Le changement par rapport à la valeur précédente
1 janv. 2002
22.8
+22.8
0.0%
1 janv. 2003
22.397
-0.404
-1.77%
1 janv. 2004
24.003
+1.606
7.17%
1 janv. 2005
23.757
-0.246
-1.02%
1 janv. 2006
23.6
-0.157
-0.66%
1 janv. 2007
23.584
-0.016
-0.07%
1 janv. 2008
23.516
-0.068
-0.29%
1 janv. 2009
23.779
+0.263
1.12%
1 janv. 2010
22.776
-1.002
-4.22%
1 janv. 2011
23.517
+0.74
3.25%
1 janv. 2012
23.338
-0.178
-0.76%
Classement des pays selon les statistiques actuelles par années


Commentaires: