29
/fr/
fr
AIzaSyAYiBZKx7MnpbEhh9jyipgxe19OcubqV5w
April 1, 2024
134044
France
FRA
true
2
1
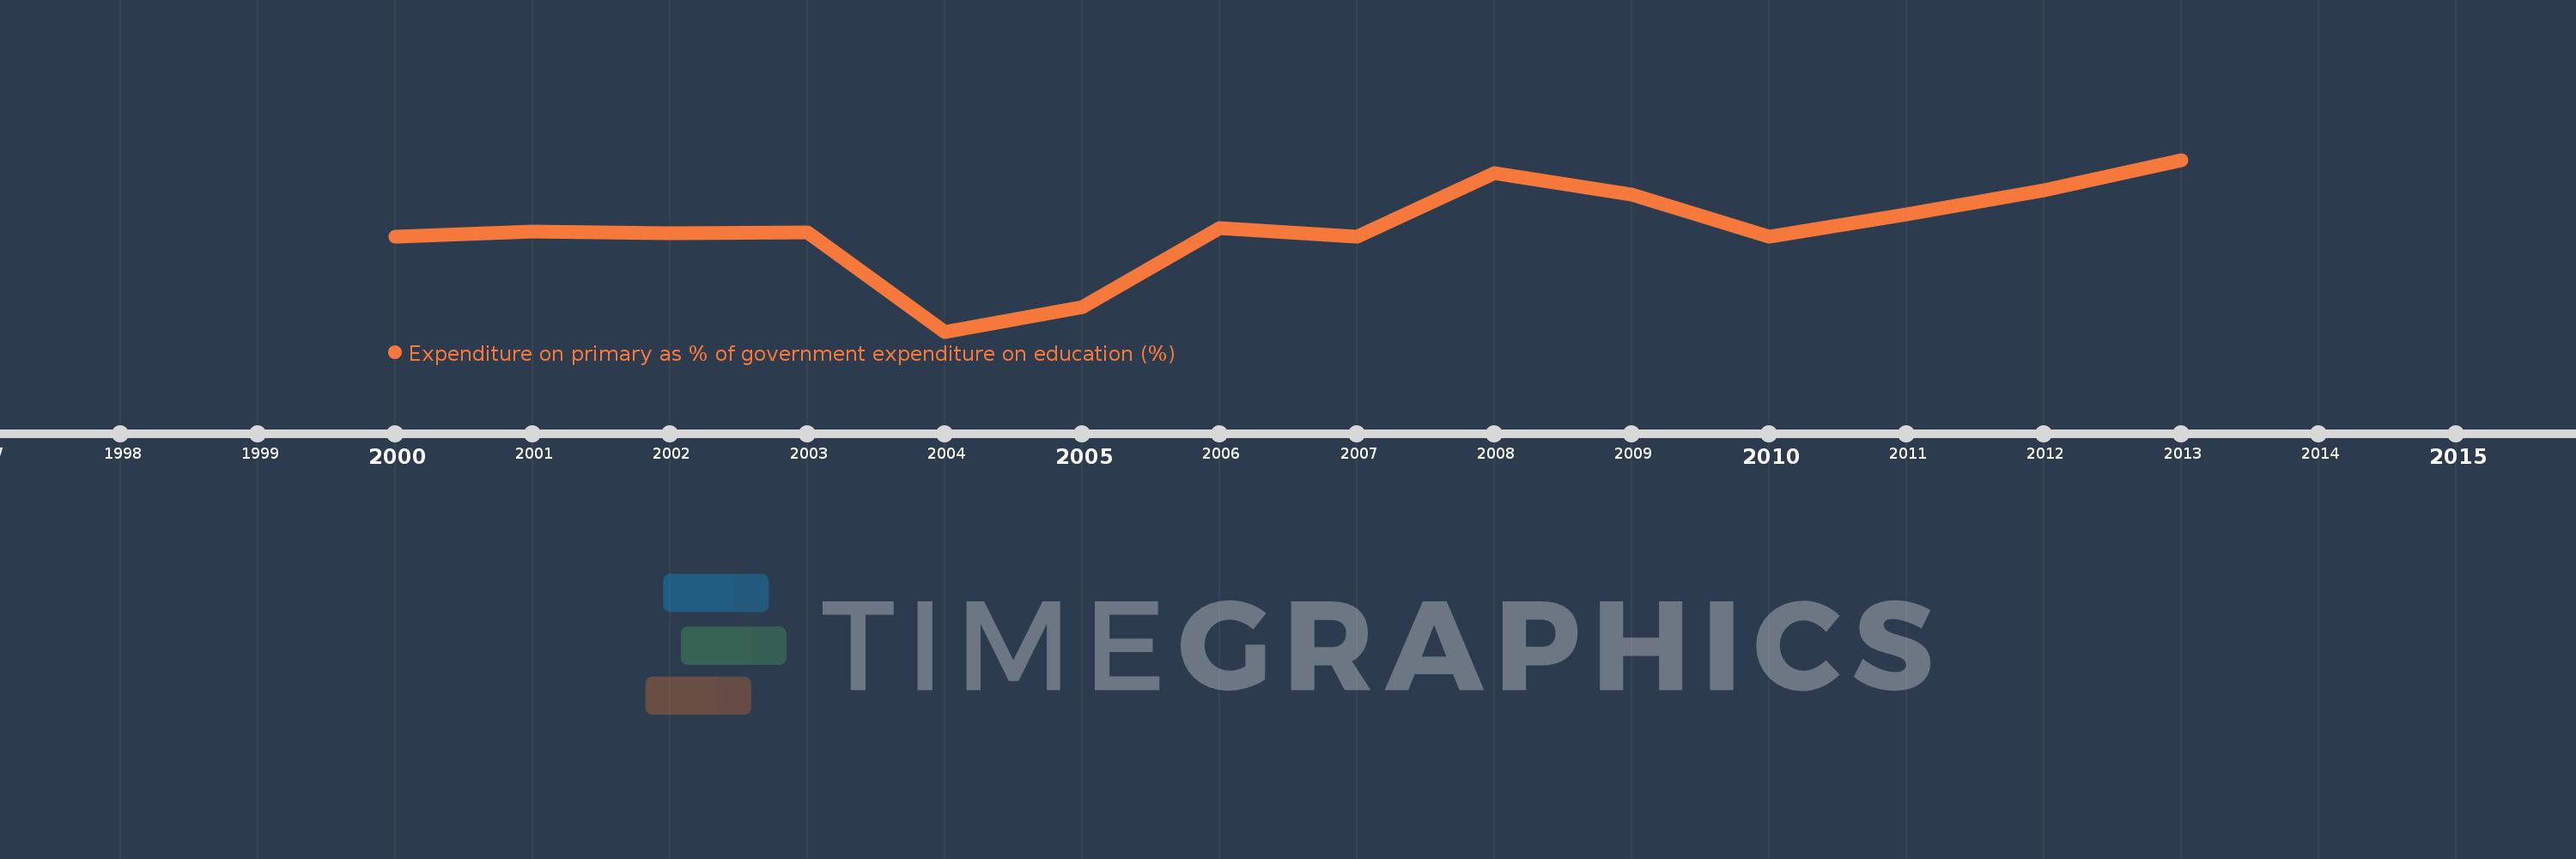
Expenditure on primary as % of government expenditure on education (%)
2013,2012,2011,2010,2009,2008,2007,2006,2005,2004,2003,2002,2001,2000
Cette statistique dans les autres pays:
La ligne de temps
Cette échelle de temps montre un graphique de 2000 année à 2013 année France. Les données jusqu'à 1999 année ne sont pas présentés. Quantité d'observations actuelles selon dates: 14.
Source (désignation):
Les indicateurs du développement mondiale
Source (organisation):
UNESCO Institute for Statistics
Catégories:
Education
Dernière mise à jour
23 avr. 2017
Les indicateurs de changement de valeurs selon les années
Minimum:
18.809
1 janv. 2004
Maximum:
21.135
1 janv. 2013
Pour la date d''observation
Valeur
Changement absolu
Le changement par rapport à la valeur précédente
1 janv. 2000
20.096
+20.096
0.0%
1 janv. 2001
20.169
+0.073
0.36%
1 janv. 2002
20.135
-0.034
-0.17%
1 janv. 2003
20.155
+0.02
0.1%
1 janv. 2004
18.809
-1.346
-6.68%
1 janv. 2005
19.14
+0.331
1.76%
1 janv. 2006
20.207
+1.068
5.58%
1 janv. 2007
20.094
-0.113
-0.56%
1 janv. 2008
20.959
+0.864
4.3%
1 janv. 2009
20.666
-0.292
-1.39%
1 janv. 2010
20.093
-0.574
-2.78%
1 janv. 2011
20.398
+0.305
1.52%
1 janv. 2012
20.723
+0.324
1.59%
1 janv. 2013
21.135
+0.413
1.99%
Classement des pays selon les statistiques actuelles par années


Commentaires: