29
/fr/
fr
AIzaSyAYiBZKx7MnpbEhh9jyipgxe19OcubqV5w
April 1, 2024
198500
Monaco
MCO
true
2
1
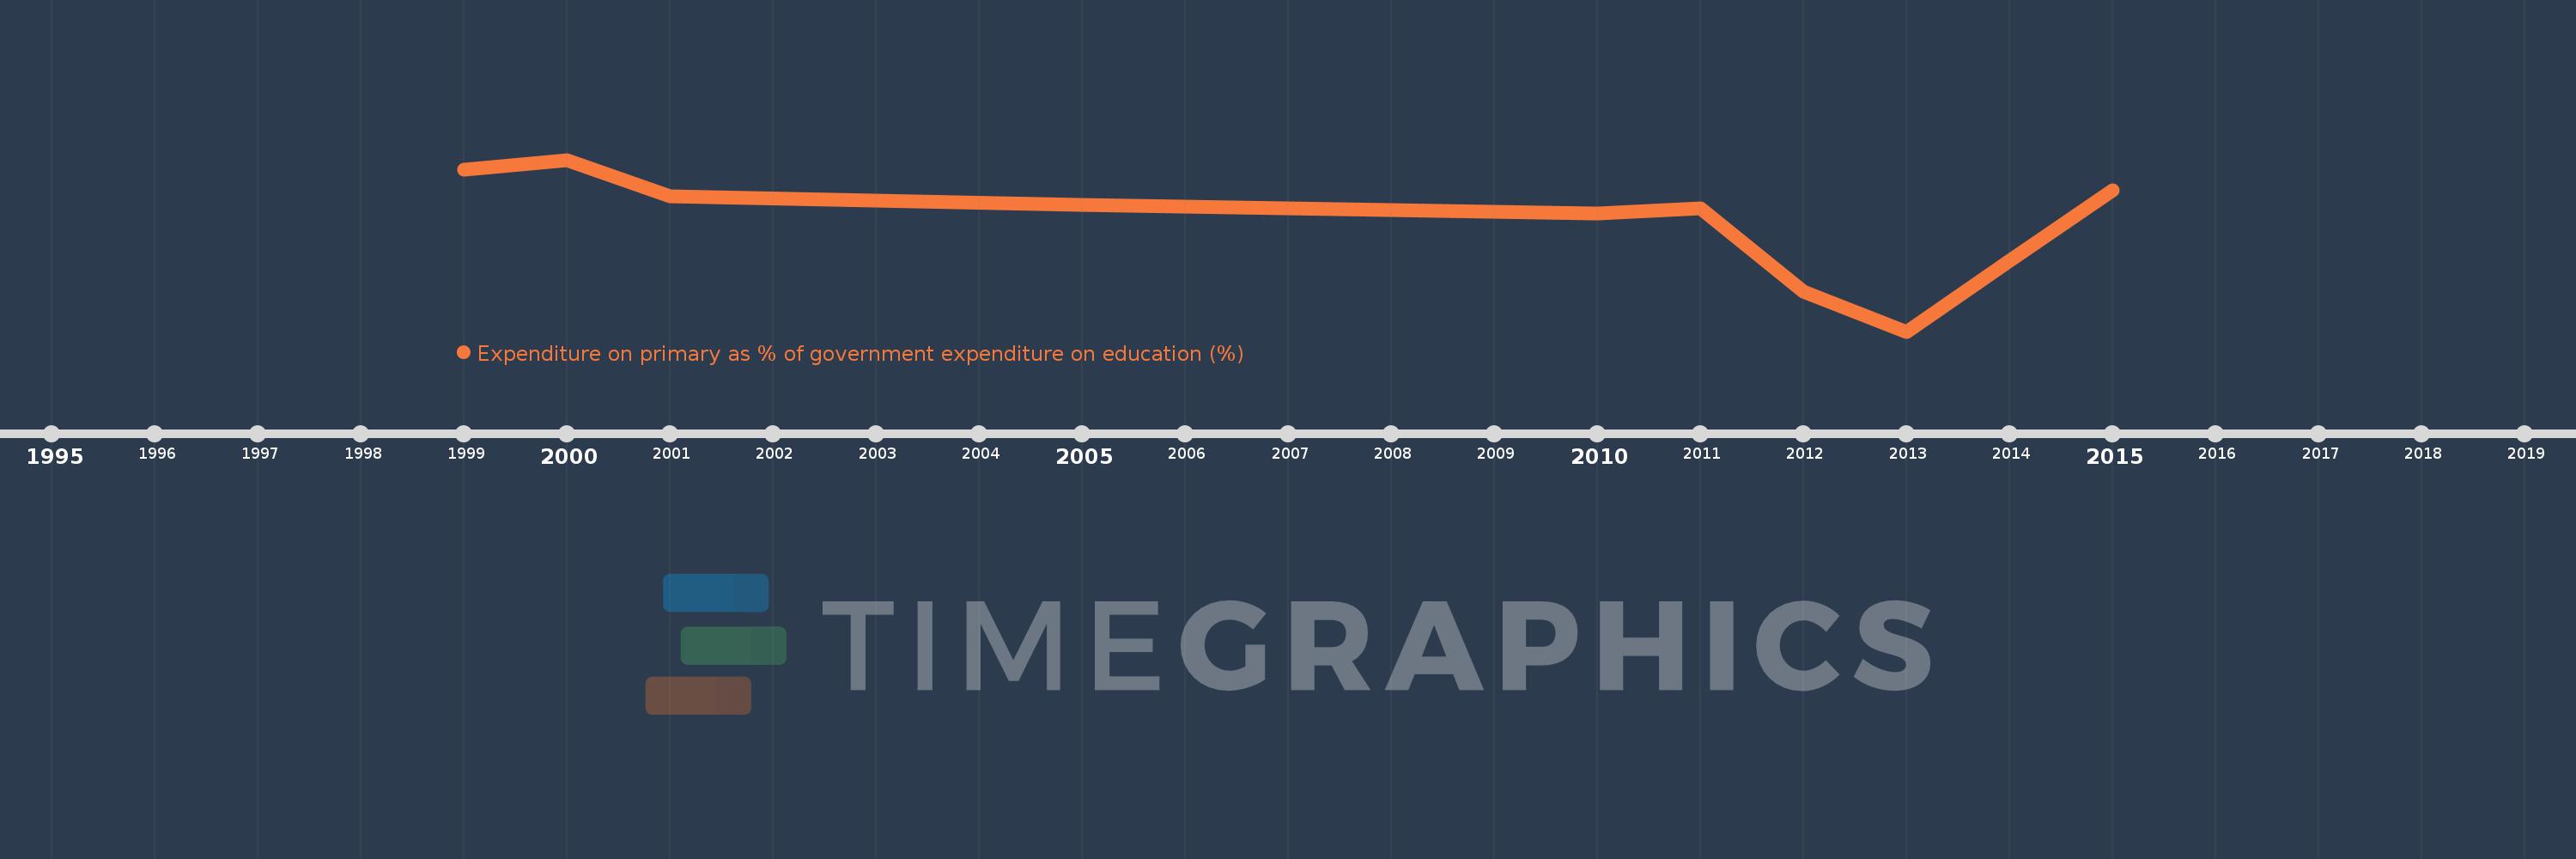
Expenditure on primary as % of government expenditure on education (%)
2015,2014,2013,2012,2011,2010,2005,2001,2000,1999
Cette statistique dans les autres pays:
La ligne de temps
Cette échelle de temps montre un graphique de 1999 année à 2015 année Monaco. Les données jusqu'à 1998 année ne sont pas présentés. Quantité d'observations actuelles selon dates: 10.
Source (désignation):
Les indicateurs du développement mondiale
Source (organisation):
UNESCO Institute for Statistics
Catégories:
Education
Dernière mise à jour
23 avr. 2017
Les indicateurs de changement de valeurs selon les années
Minimum:
10.255
1 janv. 2013
Maximum:
17.234
1 janv. 2000
Pour la date d''observation
Valeur
Changement absolu
Le changement par rapport à la valeur précédente
1 janv. 1999
16.846
+16.846
0.0%
1 janv. 2000
17.234
+0.388
2.3%
1 janv. 2001
15.753
-1.481
-8.6%
1 janv. 2005
15.391
-0.362
-2.3%
1 janv. 2010
15.052
-0.339
-2.21%
1 janv. 2011
15.252
+0.2
1.33%
1 janv. 2012
11.886
-3.365
-22.07%
1 janv. 2013
10.255
-1.631
-13.72%
1 janv. 2014
13.119
+2.864
27.92%
1 janv. 2015
15.994
+2.875
21.91%
Classement des pays selon les statistiques actuelles par années


Commentaires: