29
/
en
AIzaSyAYiBZKx7MnpbEhh9jyipgxe19OcubqV5w
April 1, 2024
69854
Argentina
ARG
true
2
1
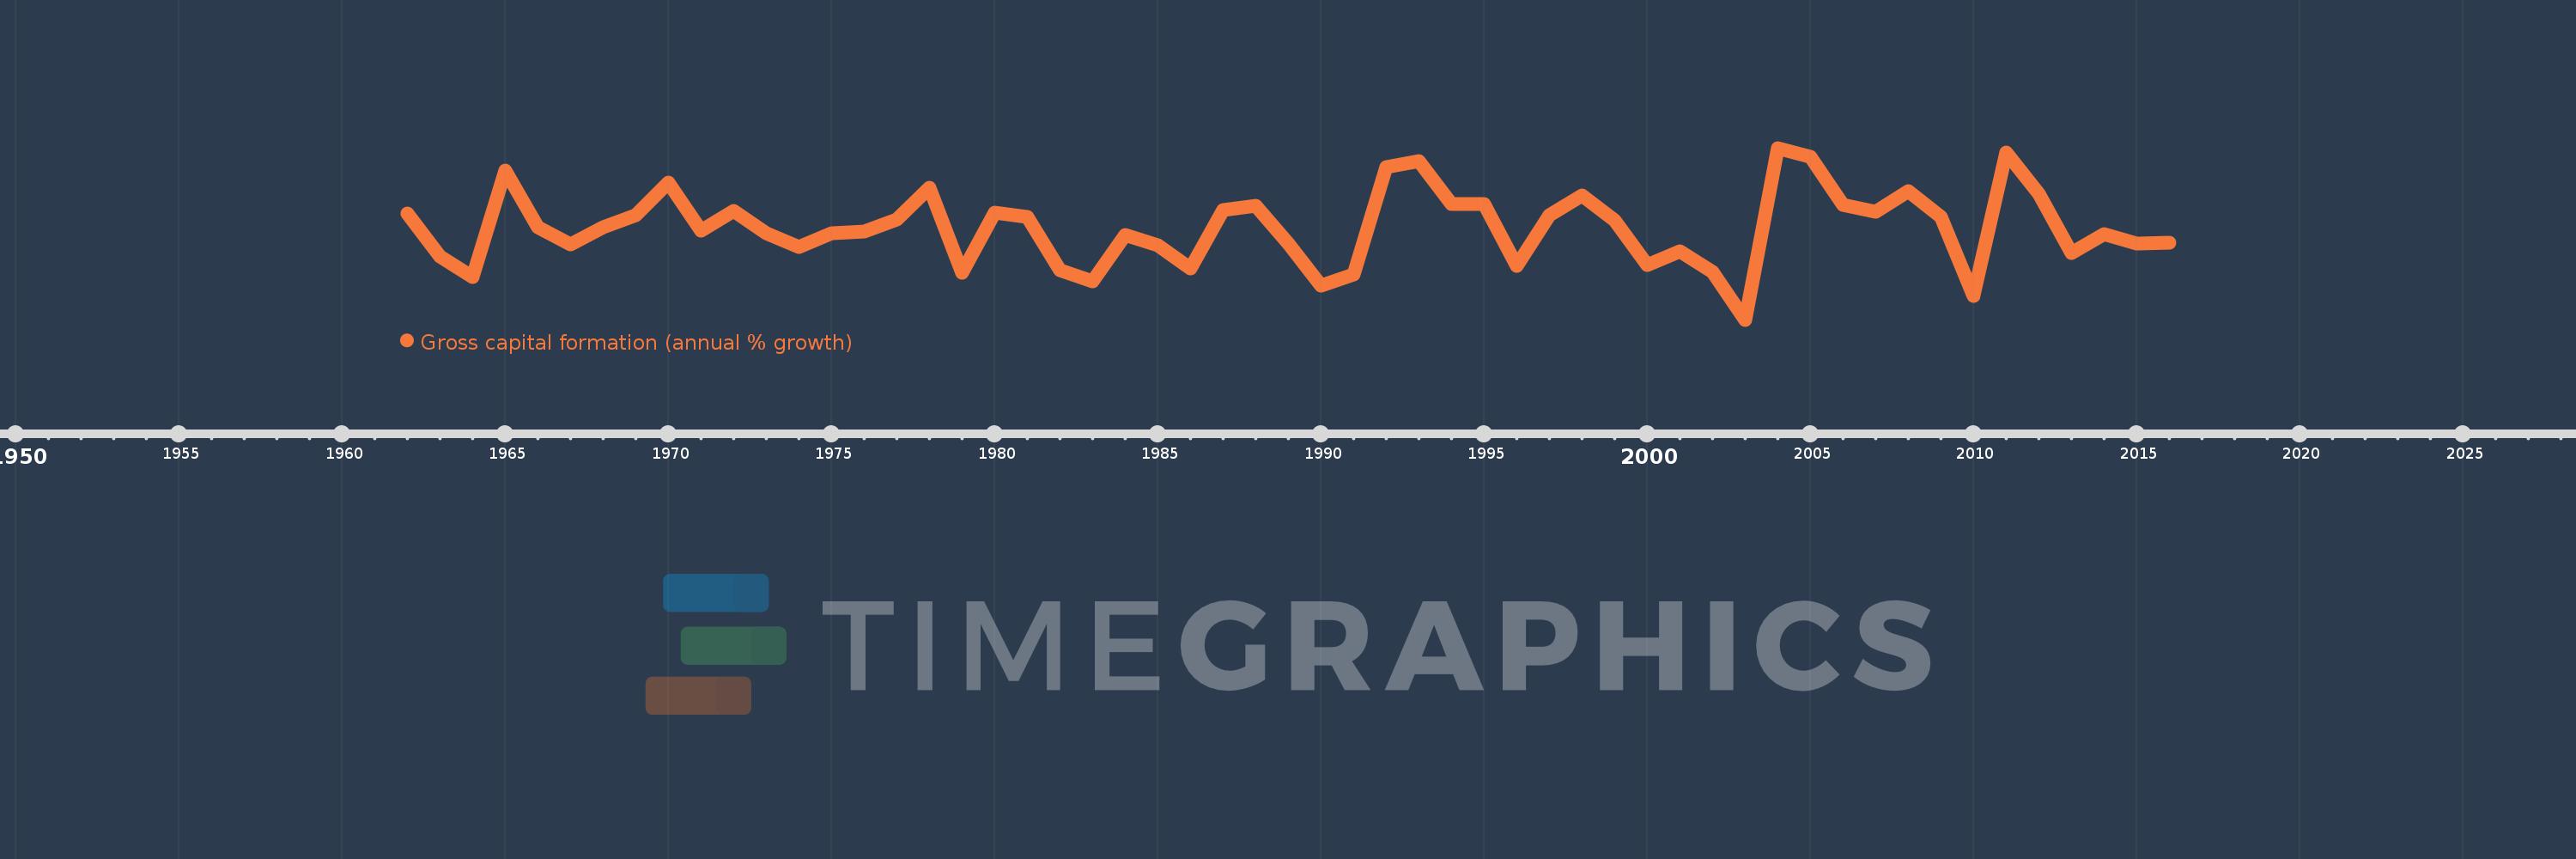
Gross capital formation (annual % growth)
2016,2015,2014,2013,2012,2011,2010,2009,2008,2007,2006,2005,2004,2003,2002,2001,2000,1999,1998,1997,1996,1995,1994,1993,1992,1991,1990,1989,1988,1987,1986,1985,1984,1983,1982,1981,1980,1979,1978,1977,1976,1975,1974,1973,1972,1971,1970,1969,1968,1967,1966,1965,1964,1963,1962
This statistics in other country:
AlbaniaAlgeriaAntigua and BarbudaArab WorldArgentinaArmeniaAustraliaAustriaAzerbaijanBahamas, TheBahrainBangladeshBarbadosBelarusBelgiumBelizeBeninBhutanBoliviaBosnia and HerzegovinaBotswanaBrazilBrunei DarussalamBulgariaBurkina FasoBurundiCabo VerdeCambodiaCameroonCanadaCaribbean small statesCentral Europe and the BalticsChadChileChinaColombiaComorosCongo, Dem. Rep.Congo, Rep.Costa RicaCote d'IvoireCroatiaCubaCyprusCzech RepublicDenmarkDjiboutiDominican RepublicEarly-demographic dividendEast Asia & PacificEast Asia & Pacific (excluding high income)East Asia & Pacific (IDA & IBRD countries)EcuadorEgypt, Arab Rep.El SalvadorEquatorial GuineaEritreaEstoniaEthiopiaEuro areaEurope & Central AsiaEurope & Central Asia (excluding high income)Europe & Central Asia (IDA & IBRD countries)European UnionFijiFinlandFranceGabonGambia, TheGeorgiaGermanyGhanaGreeceGuatemalaGuineaGuinea-BissauHaitiHeavily indebted poor countries (HIPC)High incomeHondurasHong Kong SAR, ChinaHungaryIBRD onlyIcelandIDA & IBRD totalIDA blendIDA onlyIDA totalIndiaIndonesiaIran, Islamic Rep.IrelandIsraelItalyJamaicaJapanJordanKazakhstanKenyaKorea, Rep.KosovoKuwaitKyrgyz RepublicLao PDRLate-demographic dividendLatin America & Caribbean Latin America & Caribbean (excluding high income)Latin America & the Caribbean (IDA & IBRD countries)LatviaLeast developed countries: UN classificationLebanonLiberiaLithuaniaLow & middle incomeLow incomeLower middle incomeLuxembourgMacao SAR, ChinaMacedonia, FYRMadagascarMalawiMalaysiaMaliMaltaMauritaniaMauritiusMexicoMiddle East & North AfricaMiddle East & North Africa (excluding high income)Middle East & North Africa (IDA & IBRD countries)Middle incomeMoldovaMongoliaMontenegroMoroccoMozambiqueNamibiaNepalNetherlandsNew ZealandNicaraguaNigerNigeriaNorth AmericaNorwayOECD membersOmanOther small statesPakistanPanamaPapua New GuineaParaguayPeruPhilippinesPolandPortugalPost-demographic dividendPre-demographic dividendPuerto RicoQatarRomaniaRussian FederationRwandaSaudi ArabiaSenegalSerbiaSeychellesSierra LeoneSingaporeSlovak RepublicSloveniaSmall statesSomaliaSouth AfricaSouth AsiaSouth Asia (IDA & IBRD)South SudanSpainSri LankaSub-Saharan Africa Sub-Saharan Africa (excluding high income)Sub-Saharan Africa (IDA & IBRD countries)SudanSurinameSwazilandSwedenSwitzerlandSyrian Arab RepublicTajikistanTanzaniaThailandTimor-LesteTogoTrinidad and TobagoTunisiaTurkeyTurkmenistanUgandaUkraineUnited Arab EmiratesUnited KingdomUnited StatesUpper middle incomeUruguayUzbekistanVanuatuVenezuela, RBVietnamWest Bank and GazaWorldZimbabwe Timeline:
This timeline shows a graph from 1962 to 2016 of Argentina. No data until 1961. Number of actual observations by date: 55.
Source name:
World Development Indicators
Source organization:
World Bank national accounts data, and OECD National Accounts data files.
Categories, topics:
Economy & Growth
Last updated:
apr 23, 2017
Indicators value changes by year
Minimum:
-36.448
jan 1, 2003
Maximum:
38.166
jan 1, 2004
At the date of observation
Value
Absolute change
Change from previous value
jan 1, 1962
9.677
+9.677
0.0%
jan 1, 1963
-8.823
-18.501
-191.18%
jan 1, 1964
-17.742
-8.919
101.08%
jan 1, 1965
28.431
+46.173
-260.25%
jan 1, 1966
3.817
-24.615
-86.58%
jan 1, 1967
-3.676
-7.493
-196.32%
jan 1, 1968
3.817
+7.494
-203.83%
jan 1, 1969
8.824
+5.007
131.16%
jan 1, 1970
22.973
+14.149
160.36%
jan 1, 1971
2.231
-20.742
-90.29%
jan 1, 1972
10.932
+8.701
390.05%
jan 1, 1973
1.017
-9.915
-90.7%
jan 1, 1974
-4.7
-5.717
-562.06%
jan 1, 1975
1.107
+5.807
-123.56%
jan 1, 1976
1.792
+0.685
61.85%
jan 1, 1977
6.943
+5.151
287.45%
jan 1, 1978
20.896
+13.953
200.95%
jan 1, 1979
-15.923
-36.819
-176.2%
jan 1, 1980
10.212
+26.134
-164.13%
jan 1, 1981
8.107
-2.105
-20.61%
jan 1, 1982
-14.976
-23.083
-284.73%
jan 1, 1983
-19.943
-4.967
33.17%
jan 1, 1984
0.4
+20.342
-102.0%
jan 1, 1985
-4.134
-4.534
-1.13K%
jan 1, 1986
-14.105
-9.97
241.16%
jan 1, 1987
11.041
+25.145
-178.28%
jan 1, 1988
12.936
+1.895
17.16%
jan 1, 1989
-3.52
-16.456
-127.21%
jan 1, 1990
-21.602
-18.082
513.73%
jan 1, 1991
-16.85
+4.751
-22.0%
jan 1, 1992
29.942
+46.792
-277.69%
jan 1, 1993
32.643
+2.702
9.02%
jan 1, 1994
13.623
-19.02
-58.27%
jan 1, 1995
13.672
+0.049
0.36%
jan 1, 1996
-13.084
-26.756
-195.7%
jan 1, 1997
8.883
+21.967
-167.89%
jan 1, 1998
17.663
+8.78
98.83%
jan 1, 1999
6.544
-11.119
-62.95%
jan 1, 2000
-12.61
-19.154
-292.69%
jan 1, 2001
-6.804
+5.806
-46.04%
jan 1, 2002
-15.661
-8.857
130.17%
jan 1, 2003
-36.448
-20.787
132.73%
jan 1, 2004
38.166
+74.614
-204.72%
jan 1, 2005
34.425
-3.741
-9.8%
jan 1, 2006
13.315
-21.11
-61.32%
jan 1, 2007
10.622
-2.693
-20.22%
jan 1, 2008
19.415
+8.793
82.78%
jan 1, 2009
8.138
-11.278
-58.09%
jan 1, 2010
-26.194
-34.332
-421.88%
jan 1, 2011
36.161
+62.355
-238.05%
jan 1, 2012
18.356
-17.804
-49.24%
jan 1, 2013
-7.299
-25.655
-139.76%
jan 1, 2014
0.803
+8.102
-111.0%
jan 1, 2015
-3.498
-4.301
-535.49%
jan 1, 2016
-2.92
+0.577
-16.51%
Ranking of countries by current statistics by years


Comments: