29
/
en
AIzaSyAYiBZKx7MnpbEhh9jyipgxe19OcubqV5w
April 1, 2024
268027
Tunisia
TUN
true
2
1
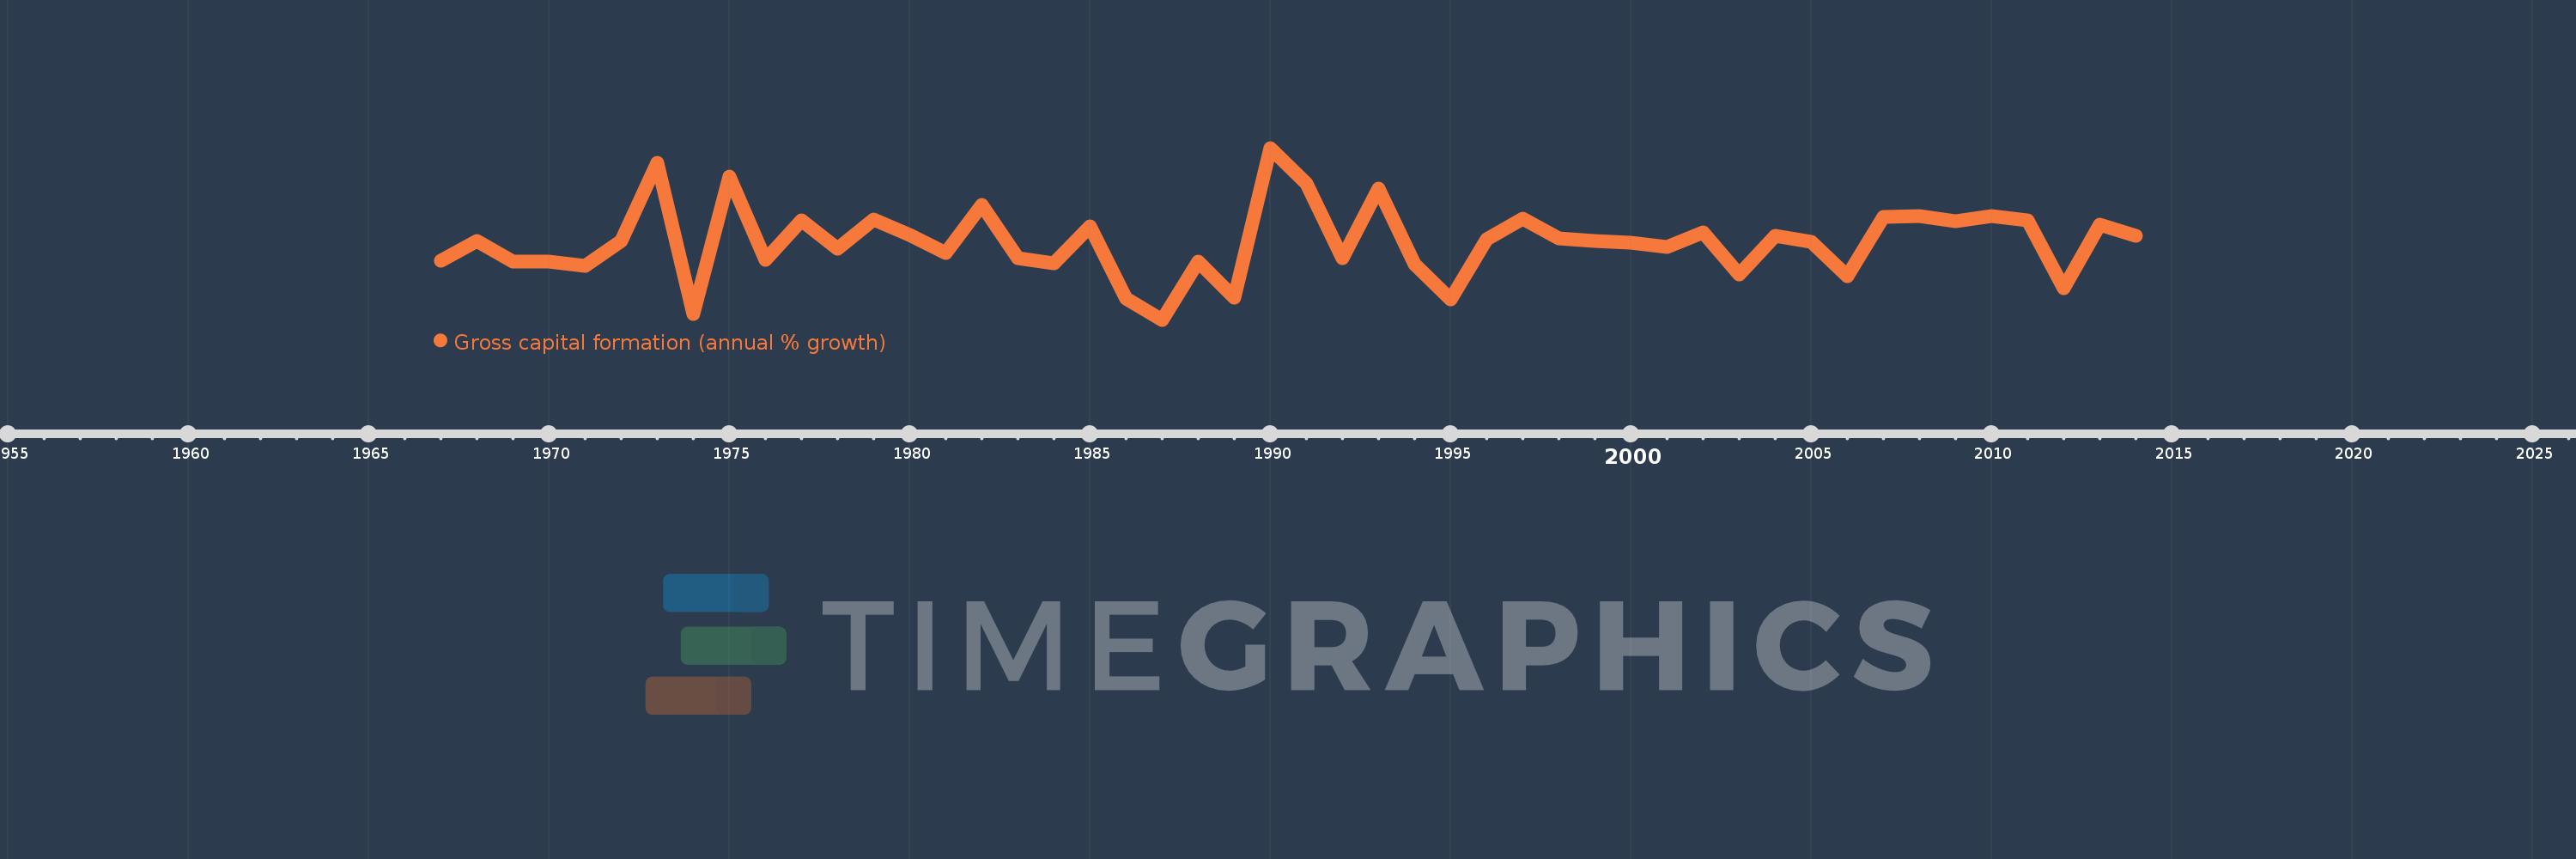
Gross capital formation (annual % growth)
2014,2013,2012,2011,2010,2009,2008,2007,2006,2005,2004,2003,2002,2001,2000,1999,1998,1997,1996,1995,1994,1993,1992,1991,1990,1989,1988,1987,1986,1985,1984,1983,1982,1981,1980,1979,1978,1977,1976,1975,1974,1973,1972,1971,1970,1969,1968,1967
This statistics in other country:
AlbaniaAlgeriaAntigua and BarbudaArab WorldArgentinaArmeniaAustraliaAustriaAzerbaijanBahamas, TheBahrainBangladeshBarbadosBelarusBelgiumBelizeBeninBhutanBoliviaBosnia and HerzegovinaBotswanaBrazilBrunei DarussalamBulgariaBurkina FasoBurundiCabo VerdeCambodiaCameroonCanadaCaribbean small statesCentral Europe and the BalticsChadChileChinaColombiaComorosCongo, Dem. Rep.Congo, Rep.Costa RicaCote d'IvoireCroatiaCubaCyprusCzech RepublicDenmarkDjiboutiDominican RepublicEarly-demographic dividendEast Asia & PacificEast Asia & Pacific (excluding high income)East Asia & Pacific (IDA & IBRD countries)EcuadorEgypt, Arab Rep.El SalvadorEquatorial GuineaEritreaEstoniaEthiopiaEuro areaEurope & Central AsiaEurope & Central Asia (excluding high income)Europe & Central Asia (IDA & IBRD countries)European UnionFijiFinlandFranceGabonGambia, TheGeorgiaGermanyGhanaGreeceGuatemalaGuineaGuinea-BissauHaitiHeavily indebted poor countries (HIPC)High incomeHondurasHong Kong SAR, ChinaHungaryIBRD onlyIcelandIDA & IBRD totalIDA blendIDA onlyIDA totalIndiaIndonesiaIran, Islamic Rep.IrelandIsraelItalyJamaicaJapanJordanKazakhstanKenyaKorea, Rep.KosovoKuwaitKyrgyz RepublicLao PDRLate-demographic dividendLatin America & Caribbean Latin America & Caribbean (excluding high income)Latin America & the Caribbean (IDA & IBRD countries)LatviaLeast developed countries: UN classificationLebanonLiberiaLithuaniaLow & middle incomeLow incomeLower middle incomeLuxembourgMacao SAR, ChinaMacedonia, FYRMadagascarMalawiMalaysiaMaliMaltaMauritaniaMauritiusMexicoMiddle East & North AfricaMiddle East & North Africa (excluding high income)Middle East & North Africa (IDA & IBRD countries)Middle incomeMoldovaMongoliaMontenegroMoroccoMozambiqueNamibiaNepalNetherlandsNew ZealandNicaraguaNigerNigeriaNorth AmericaNorwayOECD membersOmanOther small statesPakistanPanamaPapua New GuineaParaguayPeruPhilippinesPolandPortugalPost-demographic dividendPre-demographic dividendPuerto RicoQatarRomaniaRussian FederationRwandaSaudi ArabiaSenegalSerbiaSeychellesSierra LeoneSingaporeSlovak RepublicSloveniaSmall statesSomaliaSouth AfricaSouth AsiaSouth Asia (IDA & IBRD)South SudanSpainSri LankaSub-Saharan Africa Sub-Saharan Africa (excluding high income)Sub-Saharan Africa (IDA & IBRD countries)SudanSurinameSwazilandSwedenSwitzerlandSyrian Arab RepublicTajikistanTanzaniaThailandTimor-LesteTogoTrinidad and TobagoTunisiaTurkeyTurkmenistanUgandaUkraineUnited Arab EmiratesUnited KingdomUnited StatesUpper middle incomeUruguayUzbekistanVanuatuVenezuela, RBVietnamWest Bank and GazaWorldZimbabwe Timeline:
This timeline shows a graph from 1967 to 2014 of Tunisia. No data until 1966. Number of actual observations by date: 48.
Source name:
World Development Indicators
Source organization:
World Bank national accounts data, and OECD National Accounts data files.
Categories, topics:
Economy & Growth
Last updated:
apr 23, 2017
Indicators value changes by year
Minimum:
-18.698
jan 1, 1987
Maximum:
31.699
jan 1, 1990
At the date of observation
Value
Absolute change
Change from previous value
jan 1, 1967
-1.384
-1.384
0.0%
jan 1, 1968
4.39
+5.774
-417.21%
jan 1, 1969
-1.517
-5.907
-134.55%
jan 1, 1970
-1.708
-0.191
12.62%
jan 1, 1971
-2.956
-1.248
73.04%
jan 1, 1972
4.528
+7.484
-253.2%
jan 1, 1973
27.286
+22.757
502.54%
jan 1, 1974
-16.935
-44.221
-162.07%
jan 1, 1975
23.409
+40.345
-238.23%
jan 1, 1976
-1.071
-24.48
-104.57%
jan 1, 1977
10.357
+11.428
-1.07K%
jan 1, 1978
2.026
-8.331
-80.44%
jan 1, 1979
10.802
+8.777
433.24%
jan 1, 1980
6.27
-4.533
-41.96%
jan 1, 1981
0.94
-5.33
-85.01%
jan 1, 1982
15.035
+14.096
1.5K%
jan 1, 1983
-0.685
-15.721
-104.56%
jan 1, 1984
-2.185
-1.499
218.68%
jan 1, 1985
8.693
+10.878
-497.94%
jan 1, 1986
-12.589
-21.282
-244.82%
jan 1, 1987
-18.698
-6.109
48.52%
jan 1, 1988
-1.752
+16.946
-90.63%
jan 1, 1989
-12.231
-10.479
598.25%
jan 1, 1990
31.699
+43.93
-359.17%
jan 1, 1991
21.387
-10.312
-32.53%
jan 1, 1992
-0.642
-22.029
-103.0%
jan 1, 1993
19.781
+20.424
-3.18K%
jan 1, 1994
-2.287
-22.069
-111.56%
jan 1, 1995
-12.786
-10.499
458.96%
jan 1, 1996
5.028
+17.814
-139.33%
jan 1, 1997
10.941
+5.913
117.59%
jan 1, 1998
5.235
-5.707
-52.16%
jan 1, 1999
4.422
-0.813
-15.53%
jan 1, 2000
3.97
-0.451
-10.21%
jan 1, 2001
2.597
-1.373
-34.59%
jan 1, 2002
6.996
+4.399
169.41%
jan 1, 2003
-5.311
-12.307
-175.91%
jan 1, 2004
6.006
+11.317
-213.08%
jan 1, 2005
4.142
-1.864
-31.04%
jan 1, 2006
-5.801
-9.943
-240.07%
jan 1, 2007
11.375
+17.176
-296.07%
jan 1, 2008
11.736
+0.361
3.17%
jan 1, 2009
10.152
-1.584
-13.5%
jan 1, 2010
11.703
+1.551
15.28%
jan 1, 2011
10.514
-1.189
-10.16%
jan 1, 2012
-9.407
-19.922
-189.47%
jan 1, 2013
9.086
+18.493
-196.58%
jan 1, 2014
5.897
-3.189
-35.1%
Ranking of countries by current statistics by years


Comments: