29
/
en
AIzaSyAYiBZKx7MnpbEhh9jyipgxe19OcubqV5w
April 1, 2024
182121
Luxembourg
LUX
true
2
1
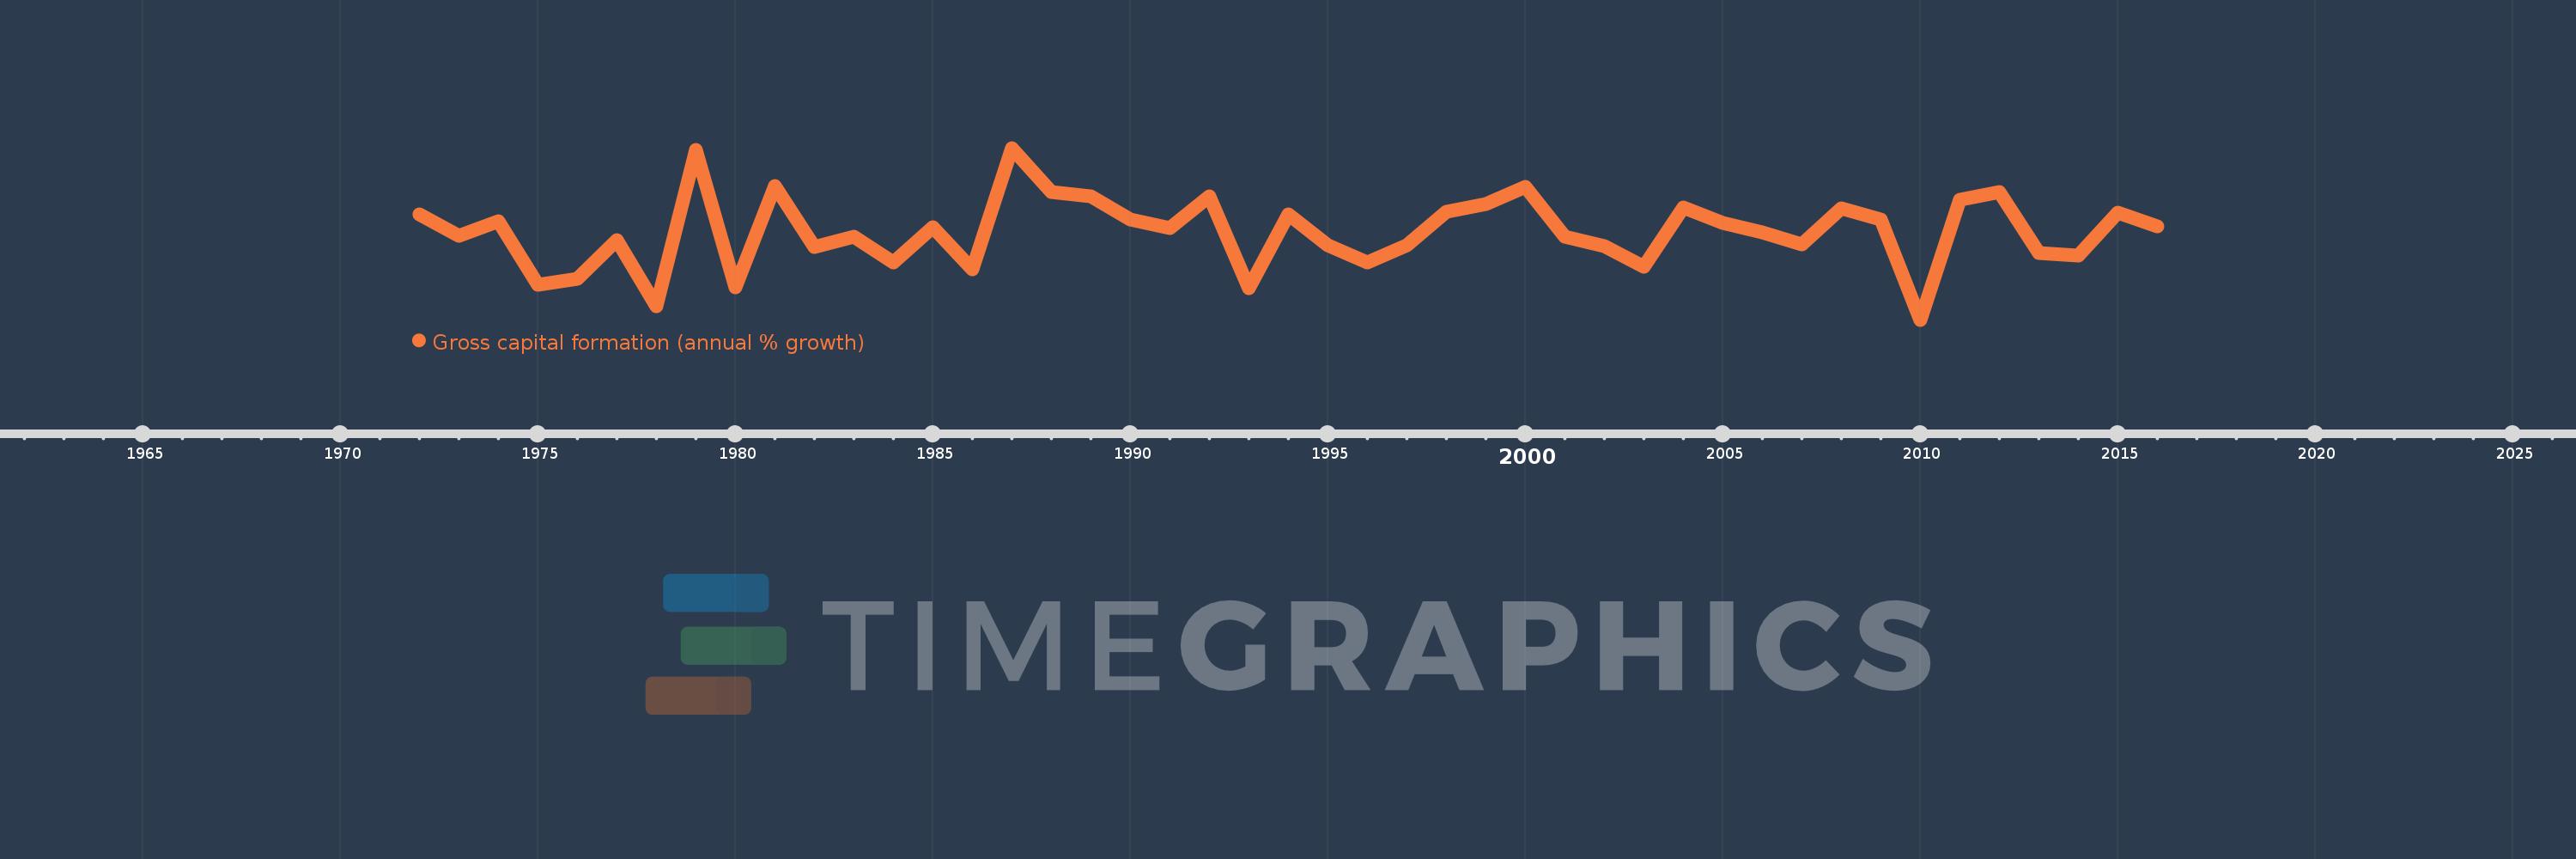
Gross capital formation (annual % growth)
2016,2015,2014,2013,2012,2011,2010,2009,2008,2007,2006,2005,2004,2003,2002,2001,2000,1999,1998,1997,1996,1995,1994,1993,1992,1991,1990,1989,1988,1987,1986,1985,1984,1983,1982,1981,1980,1979,1978,1977,1976,1975,1974,1973,1972
This statistics in other country:
AlbaniaAlgeriaAntigua and BarbudaArab WorldArgentinaArmeniaAustraliaAustriaAzerbaijanBahamas, TheBahrainBangladeshBarbadosBelarusBelgiumBelizeBeninBhutanBoliviaBosnia and HerzegovinaBotswanaBrazilBrunei DarussalamBulgariaBurkina FasoBurundiCabo VerdeCambodiaCameroonCanadaCaribbean small statesCentral Europe and the BalticsChadChileChinaColombiaComorosCongo, Dem. Rep.Congo, Rep.Costa RicaCote d'IvoireCroatiaCubaCyprusCzech RepublicDenmarkDjiboutiDominican RepublicEarly-demographic dividendEast Asia & PacificEast Asia & Pacific (excluding high income)East Asia & Pacific (IDA & IBRD countries)EcuadorEgypt, Arab Rep.El SalvadorEquatorial GuineaEritreaEstoniaEthiopiaEuro areaEurope & Central AsiaEurope & Central Asia (excluding high income)Europe & Central Asia (IDA & IBRD countries)European UnionFijiFinlandFranceGabonGambia, TheGeorgiaGermanyGhanaGreeceGuatemalaGuineaGuinea-BissauHaitiHeavily indebted poor countries (HIPC)High incomeHondurasHong Kong SAR, ChinaHungaryIBRD onlyIcelandIDA & IBRD totalIDA blendIDA onlyIDA totalIndiaIndonesiaIran, Islamic Rep.IrelandIsraelItalyJamaicaJapanJordanKazakhstanKenyaKorea, Rep.KosovoKuwaitKyrgyz RepublicLao PDRLate-demographic dividendLatin America & Caribbean Latin America & Caribbean (excluding high income)Latin America & the Caribbean (IDA & IBRD countries)LatviaLeast developed countries: UN classificationLebanonLiberiaLithuaniaLow & middle incomeLow incomeLower middle incomeLuxembourgMacao SAR, ChinaMacedonia, FYRMadagascarMalawiMalaysiaMaliMaltaMauritaniaMauritiusMexicoMiddle East & North AfricaMiddle East & North Africa (excluding high income)Middle East & North Africa (IDA & IBRD countries)Middle incomeMoldovaMongoliaMontenegroMoroccoMozambiqueNamibiaNepalNetherlandsNew ZealandNicaraguaNigerNigeriaNorth AmericaNorwayOECD membersOmanOther small statesPakistanPanamaPapua New GuineaParaguayPeruPhilippinesPolandPortugalPost-demographic dividendPre-demographic dividendPuerto RicoQatarRomaniaRussian FederationRwandaSaudi ArabiaSenegalSerbiaSeychellesSierra LeoneSingaporeSlovak RepublicSloveniaSmall statesSomaliaSouth AfricaSouth AsiaSouth Asia (IDA & IBRD)South SudanSpainSri LankaSub-Saharan Africa Sub-Saharan Africa (excluding high income)Sub-Saharan Africa (IDA & IBRD countries)SudanSurinameSwazilandSwedenSwitzerlandSyrian Arab RepublicTajikistanTanzaniaThailandTimor-LesteTogoTrinidad and TobagoTunisiaTurkeyTurkmenistanUgandaUkraineUnited Arab EmiratesUnited KingdomUnited StatesUpper middle incomeUruguayUzbekistanVanuatuVenezuela, RBVietnamWest Bank and GazaWorldZimbabwe Timeline:
This timeline shows a graph from 1972 to 2016 of Luxembourg. No data until 1971. Number of actual observations by date: 45.
Source name:
World Development Indicators
Source organization:
World Bank national accounts data, and OECD National Accounts data files.
Categories, topics:
Economy & Growth
Last updated:
apr 23, 2017
Indicators value changes by year
Minimum:
-22.292
jan 1, 2010
Maximum:
29.498
jan 1, 1987
At the date of observation
Value
Absolute change
Change from previous value
jan 1, 1972
9.516
+9.516
0.0%
jan 1, 1973
2.953
-6.563
-68.97%
jan 1, 1974
7.533
+4.58
155.09%
jan 1, 1975
-11.648
-19.181
-254.61%
jan 1, 1976
-10.033
+1.615
-13.87%
jan 1, 1977
1.601
+11.634
-115.96%
jan 1, 1978
-18.27
-19.871
-1.24K%
jan 1, 1979
28.953
+47.222
-258.48%
jan 1, 1980
-12.644
-41.597
-143.67%
jan 1, 1981
18.065
+30.709
-242.87%
jan 1, 1982
-0.307
-18.372
-101.7%
jan 1, 1983
2.637
+2.944
-958.19%
jan 1, 1984
-4.91
-7.547
-286.17%
jan 1, 1985
5.619
+10.529
-214.45%
jan 1, 1986
-7.065
-12.685
-225.73%
jan 1, 1987
29.498
+36.563
-517.5%
jan 1, 1988
16.156
-13.342
-45.23%
jan 1, 1989
14.925
-1.231
-7.62%
jan 1, 1990
7.823
-7.102
-47.59%
jan 1, 1991
5.249
-2.574
-32.9%
jan 1, 1992
14.868
+9.619
183.26%
jan 1, 1993
-12.665
-27.532
-185.18%
jan 1, 1994
9.575
+22.24
-175.6%
jan 1, 1995
0.248
-9.327
-97.41%
jan 1, 1996
-4.967
-5.214
-2.1K%
jan 1, 1997
0.058
+5.024
-101.16%
jan 1, 1998
10.314
+10.257
17.75K%
jan 1, 1999
12.47
+2.156
20.9%
jan 1, 2000
17.717
+5.246
42.07%
jan 1, 2001
2.825
-14.891
-84.05%
jan 1, 2002
-0.026
-2.851
-100.9%
jan 1, 2003
-6.349
-6.323
24.77K%
jan 1, 2004
11.551
+17.899
-281.94%
jan 1, 2005
6.827
-4.724
-40.9%
jan 1, 2006
4.003
-2.824
-41.37%
jan 1, 2007
0.354
-3.648
-91.15%
jan 1, 2008
11.26
+10.905
3.08K%
jan 1, 2009
8.004
-3.256
-28.92%
jan 1, 2010
-22.292
-30.296
-378.52%
jan 1, 2011
13.787
+36.079
-161.85%
jan 1, 2012
16.2
+2.413
17.51%
jan 1, 2013
-2.052
-18.252
-112.67%
jan 1, 2014
-2.998
-0.946
46.12%
jan 1, 2015
9.96
+12.959
-432.2%
jan 1, 2016
5.842
-4.119
-41.35%
Ranking of countries by current statistics by years


Comments: