29
/
en
AIzaSyAYiBZKx7MnpbEhh9jyipgxe19OcubqV5w
April 1, 2024
262288
Thailand
THA
true
2
1
Gross capital formation (annual % growth)
2016,2015,2014,2013,2012,2011,2010,2009,2008,2007,2006,2005,2004,2003,2002,2001,2000,1999,1998,1997,1996,1995,1994,1993,1992,1991,1990,1989,1988,1987,1986,1985,1984,1983,1982,1981,1980,1979,1978,1977,1976,1975,1974,1973,1972,1971,1970,1969,1968,1967,1966,1965,1964,1963,1962
This statistics in other country:
AlbaniaAlgeriaAntigua and BarbudaArab WorldArgentinaArmeniaAustraliaAustriaAzerbaijanBahamas, TheBahrainBangladeshBarbadosBelarusBelgiumBelizeBeninBhutanBoliviaBosnia and HerzegovinaBotswanaBrazilBrunei DarussalamBulgariaBurkina FasoBurundiCabo VerdeCambodiaCameroonCanadaCaribbean small statesCentral Europe and the BalticsChadChileChinaColombiaComorosCongo, Dem. Rep.Congo, Rep.Costa RicaCote d'IvoireCroatiaCubaCyprusCzech RepublicDenmarkDjiboutiDominican RepublicEarly-demographic dividendEast Asia & PacificEast Asia & Pacific (excluding high income)East Asia & Pacific (IDA & IBRD countries)EcuadorEgypt, Arab Rep.El SalvadorEquatorial GuineaEritreaEstoniaEthiopiaEuro areaEurope & Central AsiaEurope & Central Asia (excluding high income)Europe & Central Asia (IDA & IBRD countries)European UnionFijiFinlandFranceGabonGambia, TheGeorgiaGermanyGhanaGreeceGuatemalaGuineaGuinea-BissauHaitiHeavily indebted poor countries (HIPC)High incomeHondurasHong Kong SAR, ChinaHungaryIBRD onlyIcelandIDA & IBRD totalIDA blendIDA onlyIDA totalIndiaIndonesiaIran, Islamic Rep.IrelandIsraelItalyJamaicaJapanJordanKazakhstanKenyaKorea, Rep.KosovoKuwaitKyrgyz RepublicLao PDRLate-demographic dividendLatin America & Caribbean Latin America & Caribbean (excluding high income)Latin America & the Caribbean (IDA & IBRD countries)LatviaLeast developed countries: UN classificationLebanonLiberiaLithuaniaLow & middle incomeLow incomeLower middle incomeLuxembourgMacao SAR, ChinaMacedonia, FYRMadagascarMalawiMalaysiaMaliMaltaMauritaniaMauritiusMexicoMiddle East & North AfricaMiddle East & North Africa (excluding high income)Middle East & North Africa (IDA & IBRD countries)Middle incomeMoldovaMongoliaMontenegroMoroccoMozambiqueNamibiaNepalNetherlandsNew ZealandNicaraguaNigerNigeriaNorth AmericaNorwayOECD membersOmanOther small statesPakistanPanamaPapua New GuineaParaguayPeruPhilippinesPolandPortugalPost-demographic dividendPre-demographic dividendPuerto RicoQatarRomaniaRussian FederationRwandaSaudi ArabiaSenegalSerbiaSeychellesSierra LeoneSingaporeSlovak RepublicSloveniaSmall statesSomaliaSouth AfricaSouth AsiaSouth Asia (IDA & IBRD)South SudanSpainSri LankaSub-Saharan Africa Sub-Saharan Africa (excluding high income)Sub-Saharan Africa (IDA & IBRD countries)SudanSurinameSwazilandSwedenSwitzerlandSyrian Arab RepublicTajikistanTanzaniaThailandTimor-LesteTogoTrinidad and TobagoTunisiaTurkeyTurkmenistanUgandaUkraineUnited Arab EmiratesUnited KingdomUnited StatesUpper middle incomeUruguayUzbekistanVanuatuVenezuela, RBVietnamWest Bank and GazaWorldZimbabwe Timeline:
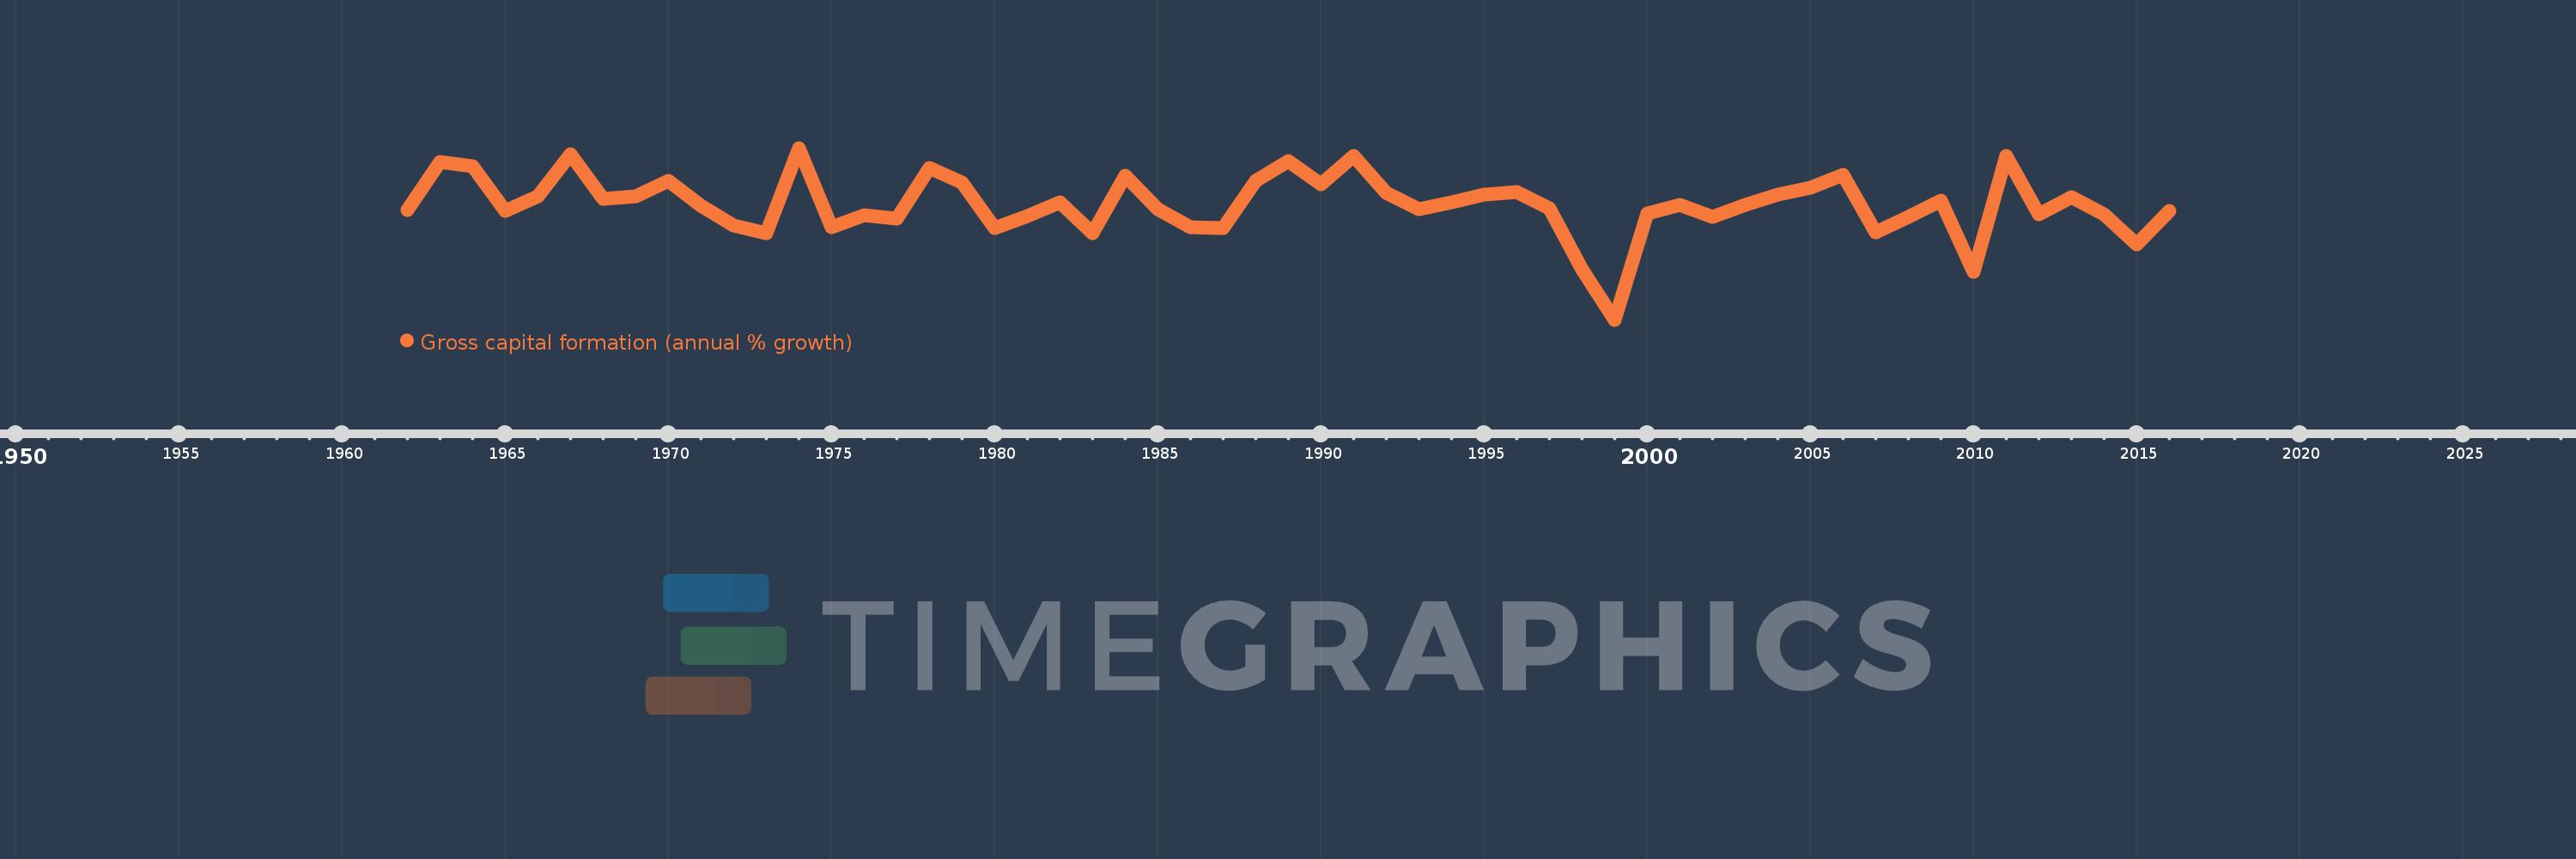
This timeline shows a graph from 1962 to 2016 of Thailand. No data until 1961. Number of actual observations by date: 55.
Source name:
World Development Indicators
Source organization:
World Bank national accounts data, and OECD National Accounts data files.
Categories, topics:
Economy & Growth
Last updated:
apr 23, 2017
Indicators value changes by year
Minimum:
-48.219
jan 1, 1999
Maximum:
34.824
jan 1, 1974
At the date of observation
Value
Absolute change
Change from previous value
jan 1, 1962
4.815
+4.815
0.0%
jan 1, 1963
28.217
+23.402
486.04%
jan 1, 1964
26.162
-2.056
-7.29%
jan 1, 1965
4.298
-21.864
-83.57%
jan 1, 1966
11.588
+7.29
169.62%
jan 1, 1967
31.935
+20.346
175.57%
jan 1, 1968
10.127
-21.808
-68.29%
jan 1, 1969
11.374
+1.247
12.32%
jan 1, 1970
19.101
+7.727
67.94%
jan 1, 1971
7.072
-12.029
-62.97%
jan 1, 1972
-2.734
-9.806
-138.66%
jan 1, 1973
-6.348
-3.614
132.19%
jan 1, 1974
34.824
+41.172
-648.59%
jan 1, 1975
-3.578
-38.401
-110.27%
jan 1, 1976
2.295
+5.873
-164.16%
jan 1, 1977
0.522
-1.773
-77.26%
jan 1, 1978
25.314
+24.792
4.75K%
jan 1, 1979
18.035
-7.279
-28.75%
jan 1, 1980
-4.123
-22.158
-122.86%
jan 1, 1981
1.695
+5.818
-141.11%
jan 1, 1982
8.391
+6.696
395.03%
jan 1, 1983
-6.408
-14.799
-176.37%
jan 1, 1984
21.579
+27.987
-436.76%
jan 1, 1985
5.236
-16.343
-75.73%
jan 1, 1986
-3.552
-8.789
-167.84%
jan 1, 1987
-3.941
-0.389
10.94%
jan 1, 1988
18.88
+22.821
-579.08%
jan 1, 1989
28.513
+9.633
51.02%
jan 1, 1990
17.332
-11.181
-39.21%
jan 1, 1991
31.131
+13.799
79.62%
jan 1, 1992
13.302
-17.829
-57.27%
jan 1, 1993
5.308
-7.994
-60.09%
jan 1, 1994
8.708
+3.4
64.04%
jan 1, 1995
12.21
+3.502
40.22%
jan 1, 1996
13.33
+1.12
9.17%
jan 1, 1997
5.446
-7.884
-59.14%
jan 1, 1998
-23.784
-29.23
-536.68%
jan 1, 1999
-48.219
-24.436
102.74%
jan 1, 2000
3.029
+51.249
-106.28%
jan 1, 2001
7.465
+4.436
146.43%
jan 1, 2002
1.539
-5.926
-79.39%
jan 1, 2003
7.165
+5.626
365.62%
jan 1, 2004
12.291
+5.126
71.53%
jan 1, 2005
15.646
+3.356
27.3%
jan 1, 2006
21.675
+6.028
38.53%
jan 1, 2007
-6.155
-27.83
-128.4%
jan 1, 2008
1.333
+7.488
-121.66%
jan 1, 2009
9.205
+7.872
590.38%
jan 1, 2010
-25.125
-34.33
-372.95%
jan 1, 2011
30.957
+56.082
-223.21%
jan 1, 2012
2.765
-28.192
-91.07%
jan 1, 2013
11.009
+8.244
298.12%
jan 1, 2014
2.891
-8.118
-73.74%
jan 1, 2015
-11.837
-14.728
-509.43%
jan 1, 2016
4.328
+16.164
-136.56%
Ranking of countries by current statistics by years


Comments: