29
/
en
AIzaSyAYiBZKx7MnpbEhh9jyipgxe19OcubqV5w
April 1, 2024
276687
United States
USA
true
2
1
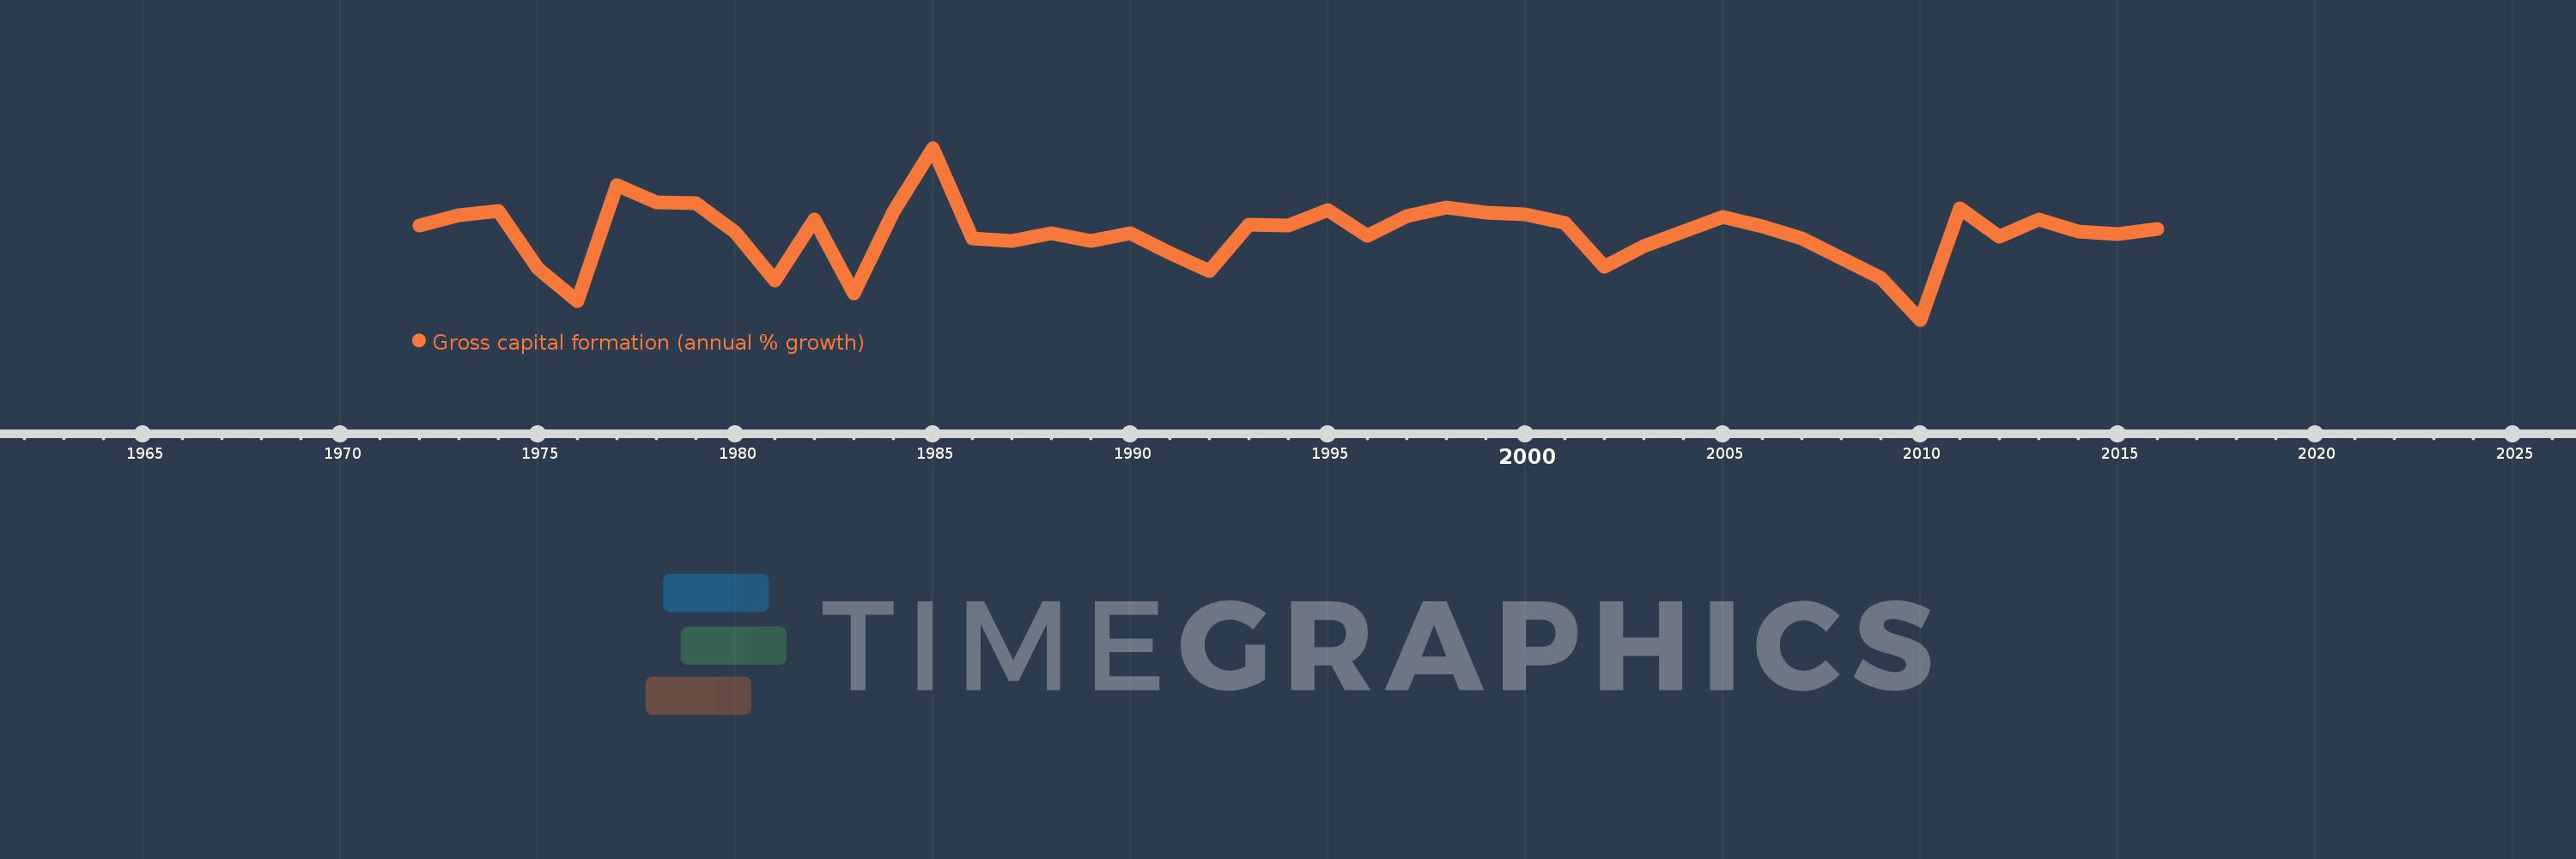
Gross capital formation (annual % growth)
2016,2015,2014,2013,2012,2011,2010,2009,2008,2007,2006,2005,2004,2003,2002,2001,2000,1999,1998,1997,1996,1995,1994,1993,1992,1991,1990,1989,1988,1987,1986,1985,1984,1983,1982,1981,1980,1979,1978,1977,1976,1975,1974,1973,1972
This statistics in other country:
AlbaniaAlgeriaAntigua and BarbudaArab WorldArgentinaArmeniaAustraliaAustriaAzerbaijanBahamas, TheBahrainBangladeshBarbadosBelarusBelgiumBelizeBeninBhutanBoliviaBosnia and HerzegovinaBotswanaBrazilBrunei DarussalamBulgariaBurkina FasoBurundiCabo VerdeCambodiaCameroonCanadaCaribbean small statesCentral Europe and the BalticsChadChileChinaColombiaComorosCongo, Dem. Rep.Congo, Rep.Costa RicaCote d'IvoireCroatiaCubaCyprusCzech RepublicDenmarkDjiboutiDominican RepublicEarly-demographic dividendEast Asia & PacificEast Asia & Pacific (excluding high income)East Asia & Pacific (IDA & IBRD countries)EcuadorEgypt, Arab Rep.El SalvadorEquatorial GuineaEritreaEstoniaEthiopiaEuro areaEurope & Central AsiaEurope & Central Asia (excluding high income)Europe & Central Asia (IDA & IBRD countries)European UnionFijiFinlandFranceGabonGambia, TheGeorgiaGermanyGhanaGreeceGuatemalaGuineaGuinea-BissauHaitiHeavily indebted poor countries (HIPC)High incomeHondurasHong Kong SAR, ChinaHungaryIBRD onlyIcelandIDA & IBRD totalIDA blendIDA onlyIDA totalIndiaIndonesiaIran, Islamic Rep.IrelandIsraelItalyJamaicaJapanJordanKazakhstanKenyaKorea, Rep.KosovoKuwaitKyrgyz RepublicLao PDRLate-demographic dividendLatin America & Caribbean Latin America & Caribbean (excluding high income)Latin America & the Caribbean (IDA & IBRD countries)LatviaLeast developed countries: UN classificationLebanonLiberiaLithuaniaLow & middle incomeLow incomeLower middle incomeLuxembourgMacao SAR, ChinaMacedonia, FYRMadagascarMalawiMalaysiaMaliMaltaMauritaniaMauritiusMexicoMiddle East & North AfricaMiddle East & North Africa (excluding high income)Middle East & North Africa (IDA & IBRD countries)Middle incomeMoldovaMongoliaMontenegroMoroccoMozambiqueNamibiaNepalNetherlandsNew ZealandNicaraguaNigerNigeriaNorth AmericaNorwayOECD membersOmanOther small statesPakistanPanamaPapua New GuineaParaguayPeruPhilippinesPolandPortugalPost-demographic dividendPre-demographic dividendPuerto RicoQatarRomaniaRussian FederationRwandaSaudi ArabiaSenegalSerbiaSeychellesSierra LeoneSingaporeSlovak RepublicSloveniaSmall statesSomaliaSouth AfricaSouth AsiaSouth Asia (IDA & IBRD)South SudanSpainSri LankaSub-Saharan Africa Sub-Saharan Africa (excluding high income)Sub-Saharan Africa (IDA & IBRD countries)SudanSurinameSwazilandSwedenSwitzerlandSyrian Arab RepublicTajikistanTanzaniaThailandTimor-LesteTogoTrinidad and TobagoTunisiaTurkeyTurkmenistanUgandaUkraineUnited Arab EmiratesUnited KingdomUnited StatesUpper middle incomeUruguayUzbekistanVanuatuVenezuela, RBVietnamWest Bank and GazaWorldZimbabwe Timeline:
This timeline shows a graph from 1972 to 2016 of United States. No data until 1971. Number of actual observations by date: 45.
Source name:
World Development Indicators
Source organization:
World Bank national accounts data, and OECD National Accounts data files.
Categories, topics:
Economy & Growth
Last updated:
apr 23, 2017
Indicators value changes by year
Minimum:
-16.892
jan 1, 2010
Maximum:
23.778
jan 1, 1985
At the date of observation
Value
Absolute change
Change from previous value
jan 1, 1972
5.45
+5.45
0.0%
jan 1, 1973
7.824
+2.374
43.56%
jan 1, 1974
8.954
+1.13
14.45%
jan 1, 1975
-4.799
-13.753
-153.6%
jan 1, 1976
-12.466
-7.666
159.73%
jan 1, 1977
14.906
+27.372
-219.58%
jan 1, 1978
10.994
-3.912
-26.25%
jan 1, 1979
10.695
-0.299
-2.72%
jan 1, 1980
3.847
-6.847
-64.03%
jan 1, 1981
-7.696
-11.543
-300.03%
jan 1, 1982
6.752
+14.448
-187.73%
jan 1, 1983
-10.573
-17.325
-256.6%
jan 1, 1984
8.728
+19.302
-182.55%
jan 1, 1985
23.778
+15.05
172.43%
jan 1, 1986
2.404
-21.374
-89.89%
jan 1, 1987
1.775
-0.629
-26.15%
jan 1, 1988
3.519
+1.743
98.19%
jan 1, 1989
1.734
-1.785
-50.72%
jan 1, 1990
3.629
+1.895
109.28%
jan 1, 1991
-1.022
-4.651
-128.18%
jan 1, 1992
-5.271
-4.248
415.5%
jan 1, 1993
5.549
+10.82
-205.28%
jan 1, 1994
5.392
-0.157
-2.83%
jan 1, 1995
9.04
+3.647
67.64%
jan 1, 1996
2.886
-6.154
-68.07%
jan 1, 1997
7.62
+4.734
164.01%
jan 1, 1998
9.695
+2.076
27.24%
jan 1, 1999
8.38
-1.316
-13.57%
jan 1, 2000
8.006
-0.373
-4.45%
jan 1, 2001
5.929
-2.077
-25.94%
jan 1, 2002
-4.339
-10.268
-173.17%
jan 1, 2003
0.623
+4.962
-114.37%
jan 1, 2004
3.976
+3.353
537.78%
jan 1, 2005
7.465
+3.489
87.74%
jan 1, 2006
5.287
-2.177
-29.17%
jan 1, 2007
2.321
-2.967
-56.11%
jan 1, 2008
-2.215
-4.535
-195.44%
jan 1, 2009
-6.986
-4.772
215.44%
jan 1, 2010
-16.892
-9.905
141.78%
jan 1, 2011
9.55
+26.441
-156.53%
jan 1, 2012
2.873
-6.677
-69.91%
jan 1, 2013
6.928
+4.055
141.13%
jan 1, 2014
3.956
-2.972
-42.9%
jan 1, 2015
3.412
-0.544
-13.75%
jan 1, 2016
4.523
+1.111
32.57%
Ranking of countries by current statistics by years


Comments: