29
/
en
AIzaSyAYiBZKx7MnpbEhh9jyipgxe19OcubqV5w
April 1, 2024
58123
South Asia (IDA & IBRD)
TSA
false
2
1
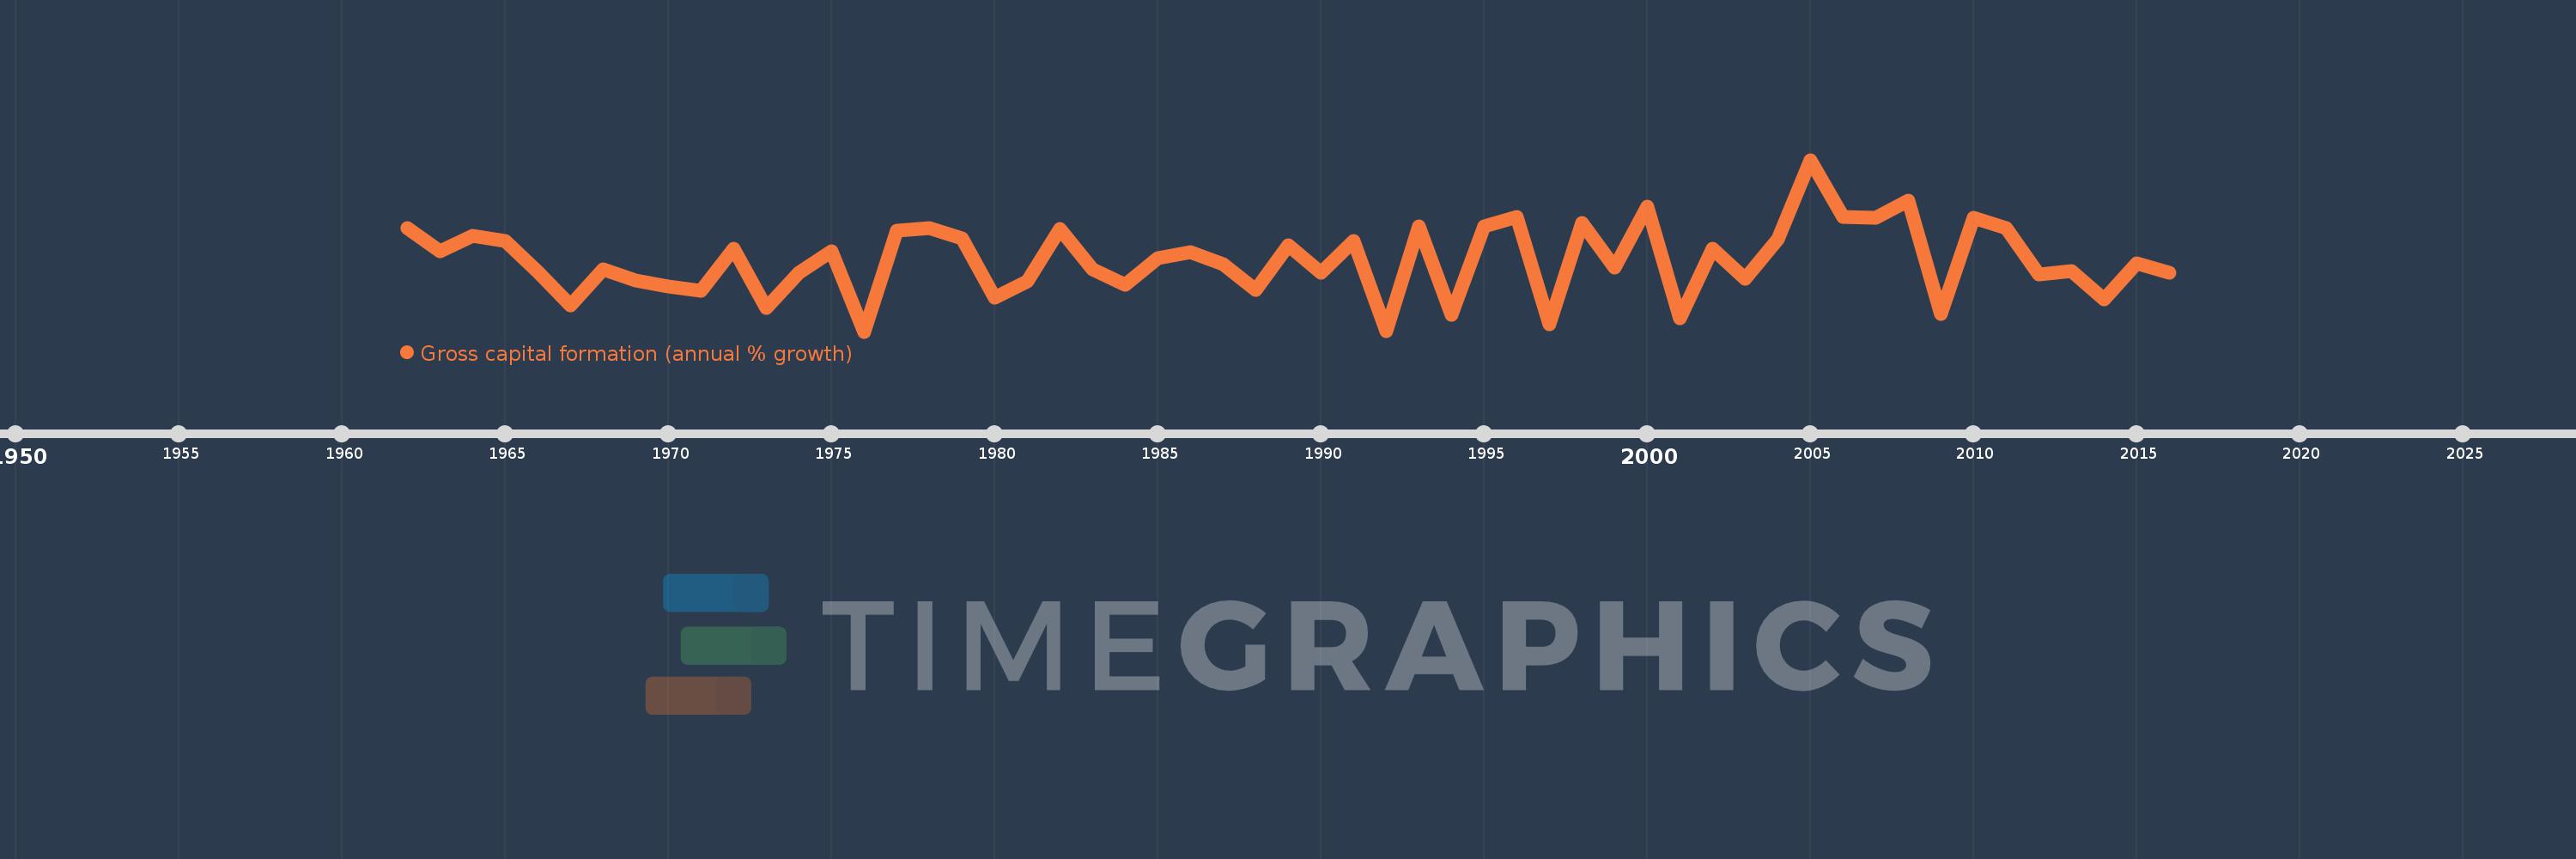
Gross capital formation (annual % growth)
2016,2015,2014,2013,2012,2011,2010,2009,2008,2007,2006,2005,2004,2003,2002,2001,2000,1999,1998,1997,1996,1995,1994,1993,1992,1991,1990,1989,1988,1987,1986,1985,1984,1983,1982,1981,1980,1979,1978,1977,1976,1975,1974,1973,1972,1971,1970,1969,1968,1967,1966,1965,1964,1963,1962
This statistics in other country:
AlbaniaAlgeriaAntigua and BarbudaArab WorldArgentinaArmeniaAustraliaAustriaAzerbaijanBahamas, TheBahrainBangladeshBarbadosBelarusBelgiumBelizeBeninBhutanBoliviaBosnia and HerzegovinaBotswanaBrazilBrunei DarussalamBulgariaBurkina FasoBurundiCabo VerdeCambodiaCameroonCanadaCaribbean small statesCentral Europe and the BalticsChadChileChinaColombiaComorosCongo, Dem. Rep.Congo, Rep.Costa RicaCote d'IvoireCroatiaCubaCyprusCzech RepublicDenmarkDjiboutiDominican RepublicEarly-demographic dividendEast Asia & PacificEast Asia & Pacific (excluding high income)East Asia & Pacific (IDA & IBRD countries)EcuadorEgypt, Arab Rep.El SalvadorEquatorial GuineaEritreaEstoniaEthiopiaEuro areaEurope & Central AsiaEurope & Central Asia (excluding high income)Europe & Central Asia (IDA & IBRD countries)European UnionFijiFinlandFranceGabonGambia, TheGeorgiaGermanyGhanaGreeceGuatemalaGuineaGuinea-BissauHaitiHeavily indebted poor countries (HIPC)High incomeHondurasHong Kong SAR, ChinaHungaryIBRD onlyIcelandIDA & IBRD totalIDA blendIDA onlyIDA totalIndiaIndonesiaIran, Islamic Rep.IrelandIsraelItalyJamaicaJapanJordanKazakhstanKenyaKorea, Rep.KosovoKuwaitKyrgyz RepublicLao PDRLate-demographic dividendLatin America & Caribbean Latin America & Caribbean (excluding high income)Latin America & the Caribbean (IDA & IBRD countries)LatviaLeast developed countries: UN classificationLebanonLiberiaLithuaniaLow & middle incomeLow incomeLower middle incomeLuxembourgMacao SAR, ChinaMacedonia, FYRMadagascarMalawiMalaysiaMaliMaltaMauritaniaMauritiusMexicoMiddle East & North AfricaMiddle East & North Africa (excluding high income)Middle East & North Africa (IDA & IBRD countries)Middle incomeMoldovaMongoliaMontenegroMoroccoMozambiqueNamibiaNepalNetherlandsNew ZealandNicaraguaNigerNigeriaNorth AmericaNorwayOECD membersOmanOther small statesPakistanPanamaPapua New GuineaParaguayPeruPhilippinesPolandPortugalPost-demographic dividendPre-demographic dividendPuerto RicoQatarRomaniaRussian FederationRwandaSaudi ArabiaSenegalSerbiaSeychellesSierra LeoneSingaporeSlovak RepublicSloveniaSmall statesSomaliaSouth AfricaSouth AsiaSouth Asia (IDA & IBRD)South SudanSpainSri LankaSub-Saharan Africa Sub-Saharan Africa (excluding high income)Sub-Saharan Africa (IDA & IBRD countries)SudanSurinameSwazilandSwedenSwitzerlandSyrian Arab RepublicTajikistanTanzaniaThailandTimor-LesteTogoTrinidad and TobagoTunisiaTurkeyTurkmenistanUgandaUkraineUnited Arab EmiratesUnited KingdomUnited StatesUpper middle incomeUruguayUzbekistanVanuatuVenezuela, RBVietnamWest Bank and GazaWorldZimbabwe Timeline:
This timeline shows a graph from 1962 to 2016 of South Asia (IDA & IBRD). No data until 1961. Number of actual observations by date: 55.
Source name:
World Development Indicators
Source organization:
World Bank national accounts data, and OECD National Accounts data files.
Categories, topics:
Economy & Growth
Last updated:
apr 23, 2017
Indicators value changes by year
Minimum:
-7.257
jan 1, 1976
Maximum:
26.729
jan 1, 2005
At the date of observation
Value
Absolute change
Change from previous value
jan 1, 1962
13.262
+13.262
0.0%
jan 1, 1963
8.562
-4.7
-35.44%
jan 1, 1964
11.759
+3.197
37.34%
jan 1, 1965
10.637
-1.122
-9.54%
jan 1, 1966
4.588
-6.049
-56.87%
jan 1, 1967
-2.085
-6.673
-145.44%
jan 1, 1968
5.065
+7.149
-342.94%
jan 1, 1969
2.924
-2.141
-42.27%
jan 1, 1970
1.678
-1.246
-42.63%
jan 1, 1971
0.822
-0.856
-51.0%
jan 1, 1972
9.077
+8.255
1.0K%
jan 1, 1973
-2.596
-11.673
-128.6%
jan 1, 1974
4.394
+6.99
-269.29%
jan 1, 1975
8.64
+4.246
96.62%
jan 1, 1976
-7.257
-15.897
-183.99%
jan 1, 1977
12.783
+20.04
-276.15%
jan 1, 1978
13.235
+0.452
3.53%
jan 1, 1979
11.163
-2.072
-15.65%
jan 1, 1980
-0.605
-11.768
-105.42%
jan 1, 1981
2.653
+3.258
-538.37%
jan 1, 1982
13.099
+10.446
393.8%
jan 1, 1983
5.132
-7.967
-60.82%
jan 1, 1984
1.993
-3.139
-61.17%
jan 1, 1985
7.336
+5.343
268.11%
jan 1, 1986
8.48
+1.144
15.6%
jan 1, 1987
6.017
-2.463
-29.05%
jan 1, 1988
0.94
-5.077
-84.38%
jan 1, 1989
9.832
+8.892
945.83%
jan 1, 1990
4.357
-5.476
-55.69%
jan 1, 1991
10.733
+6.376
146.35%
jan 1, 1992
-7.219
-17.953
-167.26%
jan 1, 1993
13.478
+20.697
-286.69%
jan 1, 1994
-3.933
-17.411
-129.18%
jan 1, 1995
13.594
+17.527
-445.63%
jan 1, 1996
15.494
+1.9
13.97%
jan 1, 1997
-5.825
-21.319
-137.59%
jan 1, 1998
14.257
+20.082
-344.76%
jan 1, 1999
5.485
-8.771
-61.52%
jan 1, 2000
17.462
+11.976
218.33%
jan 1, 2001
-4.571
-22.033
-126.18%
jan 1, 2002
9.177
+13.748
-300.75%
jan 1, 2003
3.139
-6.038
-65.79%
jan 1, 2004
11.003
+7.864
250.51%
jan 1, 2005
26.729
+15.725
142.91%
jan 1, 2006
15.489
-11.239
-42.05%
jan 1, 2007
15.289
-0.201
-1.3%
jan 1, 2008
18.639
+3.351
21.92%
jan 1, 2009
-3.745
-22.384
-120.09%
jan 1, 2010
15.238
+18.983
-506.92%
jan 1, 2011
13.229
-2.009
-13.19%
jan 1, 2012
4.122
-9.107
-68.84%
jan 1, 2013
4.661
+0.539
13.07%
jan 1, 2014
-0.827
-5.488
-117.75%
jan 1, 2015
6.246
+7.073
-855.04%
jan 1, 2016
4.35
-1.895
-30.35%
Ranking of countries by current statistics by years


Comments: