29
/
en
AIzaSyAYiBZKx7MnpbEhh9jyipgxe19OcubqV5w
April 1, 2024
118953
Denmark
DNK
true
2
1
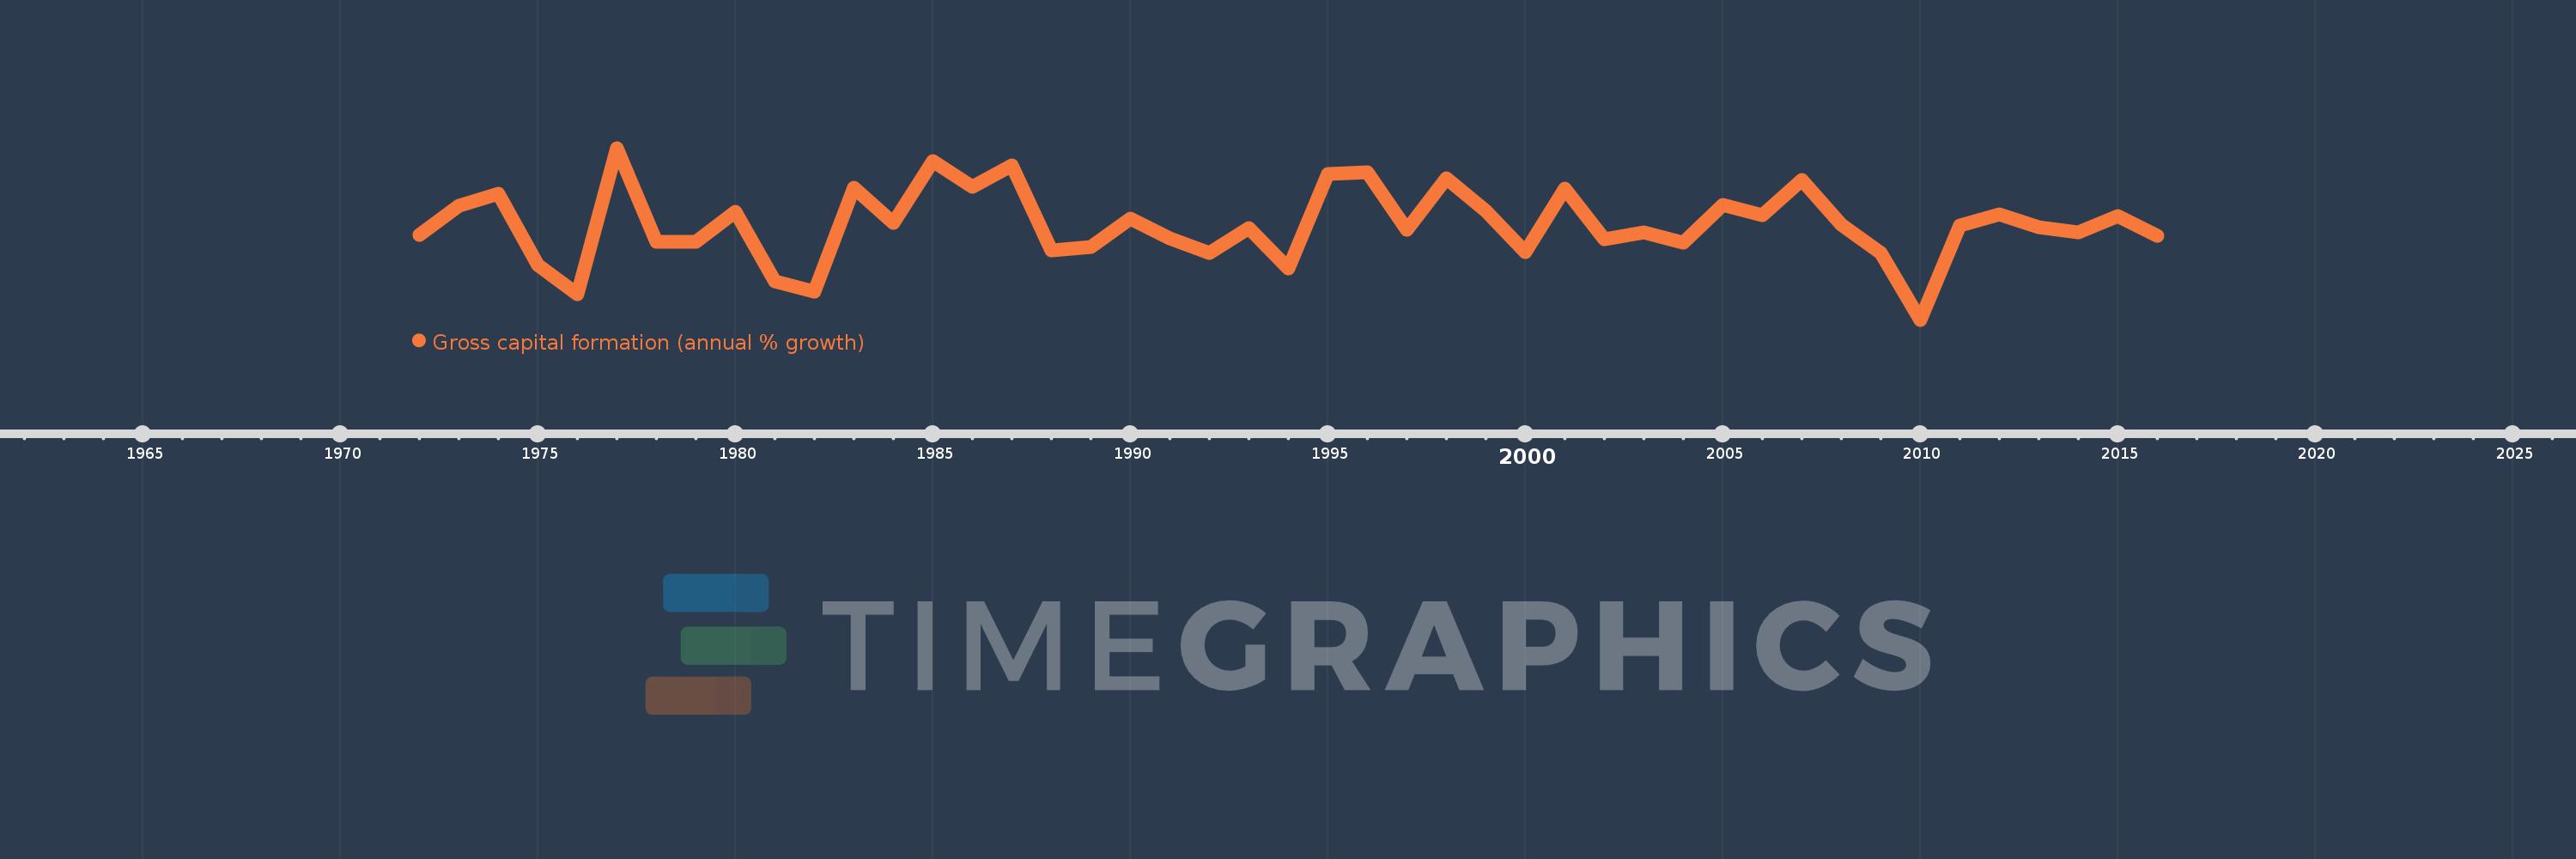
Gross capital formation (annual % growth)
2016,2015,2014,2013,2012,2011,2010,2009,2008,2007,2006,2005,2004,2003,2002,2001,2000,1999,1998,1997,1996,1995,1994,1993,1992,1991,1990,1989,1988,1987,1986,1985,1984,1983,1982,1981,1980,1979,1978,1977,1976,1975,1974,1973,1972
This statistics in other country:
AlbaniaAlgeriaAntigua and BarbudaArab WorldArgentinaArmeniaAustraliaAustriaAzerbaijanBahamas, TheBahrainBangladeshBarbadosBelarusBelgiumBelizeBeninBhutanBoliviaBosnia and HerzegovinaBotswanaBrazilBrunei DarussalamBulgariaBurkina FasoBurundiCabo VerdeCambodiaCameroonCanadaCaribbean small statesCentral Europe and the BalticsChadChileChinaColombiaComorosCongo, Dem. Rep.Congo, Rep.Costa RicaCote d'IvoireCroatiaCubaCyprusCzech RepublicDenmarkDjiboutiDominican RepublicEarly-demographic dividendEast Asia & PacificEast Asia & Pacific (excluding high income)East Asia & Pacific (IDA & IBRD countries)EcuadorEgypt, Arab Rep.El SalvadorEquatorial GuineaEritreaEstoniaEthiopiaEuro areaEurope & Central AsiaEurope & Central Asia (excluding high income)Europe & Central Asia (IDA & IBRD countries)European UnionFijiFinlandFranceGabonGambia, TheGeorgiaGermanyGhanaGreeceGuatemalaGuineaGuinea-BissauHaitiHeavily indebted poor countries (HIPC)High incomeHondurasHong Kong SAR, ChinaHungaryIBRD onlyIcelandIDA & IBRD totalIDA blendIDA onlyIDA totalIndiaIndonesiaIran, Islamic Rep.IrelandIsraelItalyJamaicaJapanJordanKazakhstanKenyaKorea, Rep.KosovoKuwaitKyrgyz RepublicLao PDRLate-demographic dividendLatin America & Caribbean Latin America & Caribbean (excluding high income)Latin America & the Caribbean (IDA & IBRD countries)LatviaLeast developed countries: UN classificationLebanonLiberiaLithuaniaLow & middle incomeLow incomeLower middle incomeLuxembourgMacao SAR, ChinaMacedonia, FYRMadagascarMalawiMalaysiaMaliMaltaMauritaniaMauritiusMexicoMiddle East & North AfricaMiddle East & North Africa (excluding high income)Middle East & North Africa (IDA & IBRD countries)Middle incomeMoldovaMongoliaMontenegroMoroccoMozambiqueNamibiaNepalNetherlandsNew ZealandNicaraguaNigerNigeriaNorth AmericaNorwayOECD membersOmanOther small statesPakistanPanamaPapua New GuineaParaguayPeruPhilippinesPolandPortugalPost-demographic dividendPre-demographic dividendPuerto RicoQatarRomaniaRussian FederationRwandaSaudi ArabiaSenegalSerbiaSeychellesSierra LeoneSingaporeSlovak RepublicSloveniaSmall statesSomaliaSouth AfricaSouth AsiaSouth Asia (IDA & IBRD)South SudanSpainSri LankaSub-Saharan Africa Sub-Saharan Africa (excluding high income)Sub-Saharan Africa (IDA & IBRD countries)SudanSurinameSwazilandSwedenSwitzerlandSyrian Arab RepublicTajikistanTanzaniaThailandTimor-LesteTogoTrinidad and TobagoTunisiaTurkeyTurkmenistanUgandaUkraineUnited Arab EmiratesUnited KingdomUnited StatesUpper middle incomeUruguayUzbekistanVanuatuVenezuela, RBVietnamWest Bank and GazaWorldZimbabwe Timeline:
This timeline shows a graph from 1972 to 2016 of Denmark. No data until 1971. Number of actual observations by date: 45.
Source name:
World Development Indicators
Source organization:
World Bank national accounts data, and OECD National Accounts data files.
Categories, topics:
Economy & Growth
Last updated:
apr 23, 2017
Indicators value changes by year
Minimum:
-22.392
jan 1, 2010
Maximum:
22.264
jan 1, 1977
At the date of observation
Value
Absolute change
Change from previous value
jan 1, 1972
-0.246
-0.246
0.0%
jan 1, 1973
7.191
+7.436
-3.03K%
jan 1, 1974
10.334
+3.143
43.71%
jan 1, 1975
-8.07
-18.404
-178.09%
jan 1, 1976
-15.661
-7.591
94.06%
jan 1, 1977
22.264
+37.924
-242.16%
jan 1, 1978
-2.066
-24.329
-109.28%
jan 1, 1979
-2.11
-0.044
2.15%
jan 1, 1980
5.571
+7.681
-364.03%
jan 1, 1981
-12.504
-18.075
-324.45%
jan 1, 1982
-15.197
-2.693
21.53%
jan 1, 1983
11.983
+27.18
-178.85%
jan 1, 1984
2.67
-9.313
-77.72%
jan 1, 1985
18.851
+16.181
606.07%
jan 1, 1986
12.137
-6.715
-35.62%
jan 1, 1987
17.814
+5.678
46.78%
jan 1, 1988
-4.362
-22.176
-124.49%
jan 1, 1989
-3.455
+0.907
-20.78%
jan 1, 1990
3.871
+7.327
-212.03%
jan 1, 1991
-1.259
-5.131
-132.53%
jan 1, 1992
-5.084
-3.825
303.69%
jan 1, 1993
1.385
+6.469
-127.23%
jan 1, 1994
-8.969
-10.353
-747.73%
jan 1, 1995
15.579
+24.547
-273.7%
jan 1, 1996
15.853
+0.275
1.76%
jan 1, 1997
1.054
-14.799
-93.35%
jan 1, 1998
14.408
+13.354
1.27K%
jan 1, 1999
5.878
-8.53
-59.2%
jan 1, 2000
-4.878
-10.757
-182.99%
jan 1, 2001
11.744
+16.622
-340.74%
jan 1, 2002
-1.473
-13.218
-112.55%
jan 1, 2003
0.317
+1.79
-121.52%
jan 1, 2004
-2.263
-2.58
-813.9%
jan 1, 2005
7.413
+9.676
-427.54%
jan 1, 2006
4.697
-2.716
-36.64%
jan 1, 2007
13.863
+9.166
195.15%
jan 1, 2008
2.265
-11.599
-83.67%
jan 1, 2009
-5.148
-7.413
-327.34%
jan 1, 2010
-22.392
-17.244
334.94%
jan 1, 2011
2.036
+24.427
-109.09%
jan 1, 2012
5.057
+3.021
148.4%
jan 1, 2013
1.586
-3.471
-68.64%
jan 1, 2014
0.365
-1.22
-76.97%
jan 1, 2015
4.633
+4.268
1.17K%
jan 1, 2016
-0.467
-5.1
-110.08%
Ranking of countries by current statistics by years


Comments: