29
/
en
AIzaSyAYiBZKx7MnpbEhh9jyipgxe19OcubqV5w
April 1, 2024
159453
Ireland
IRL
true
2
1
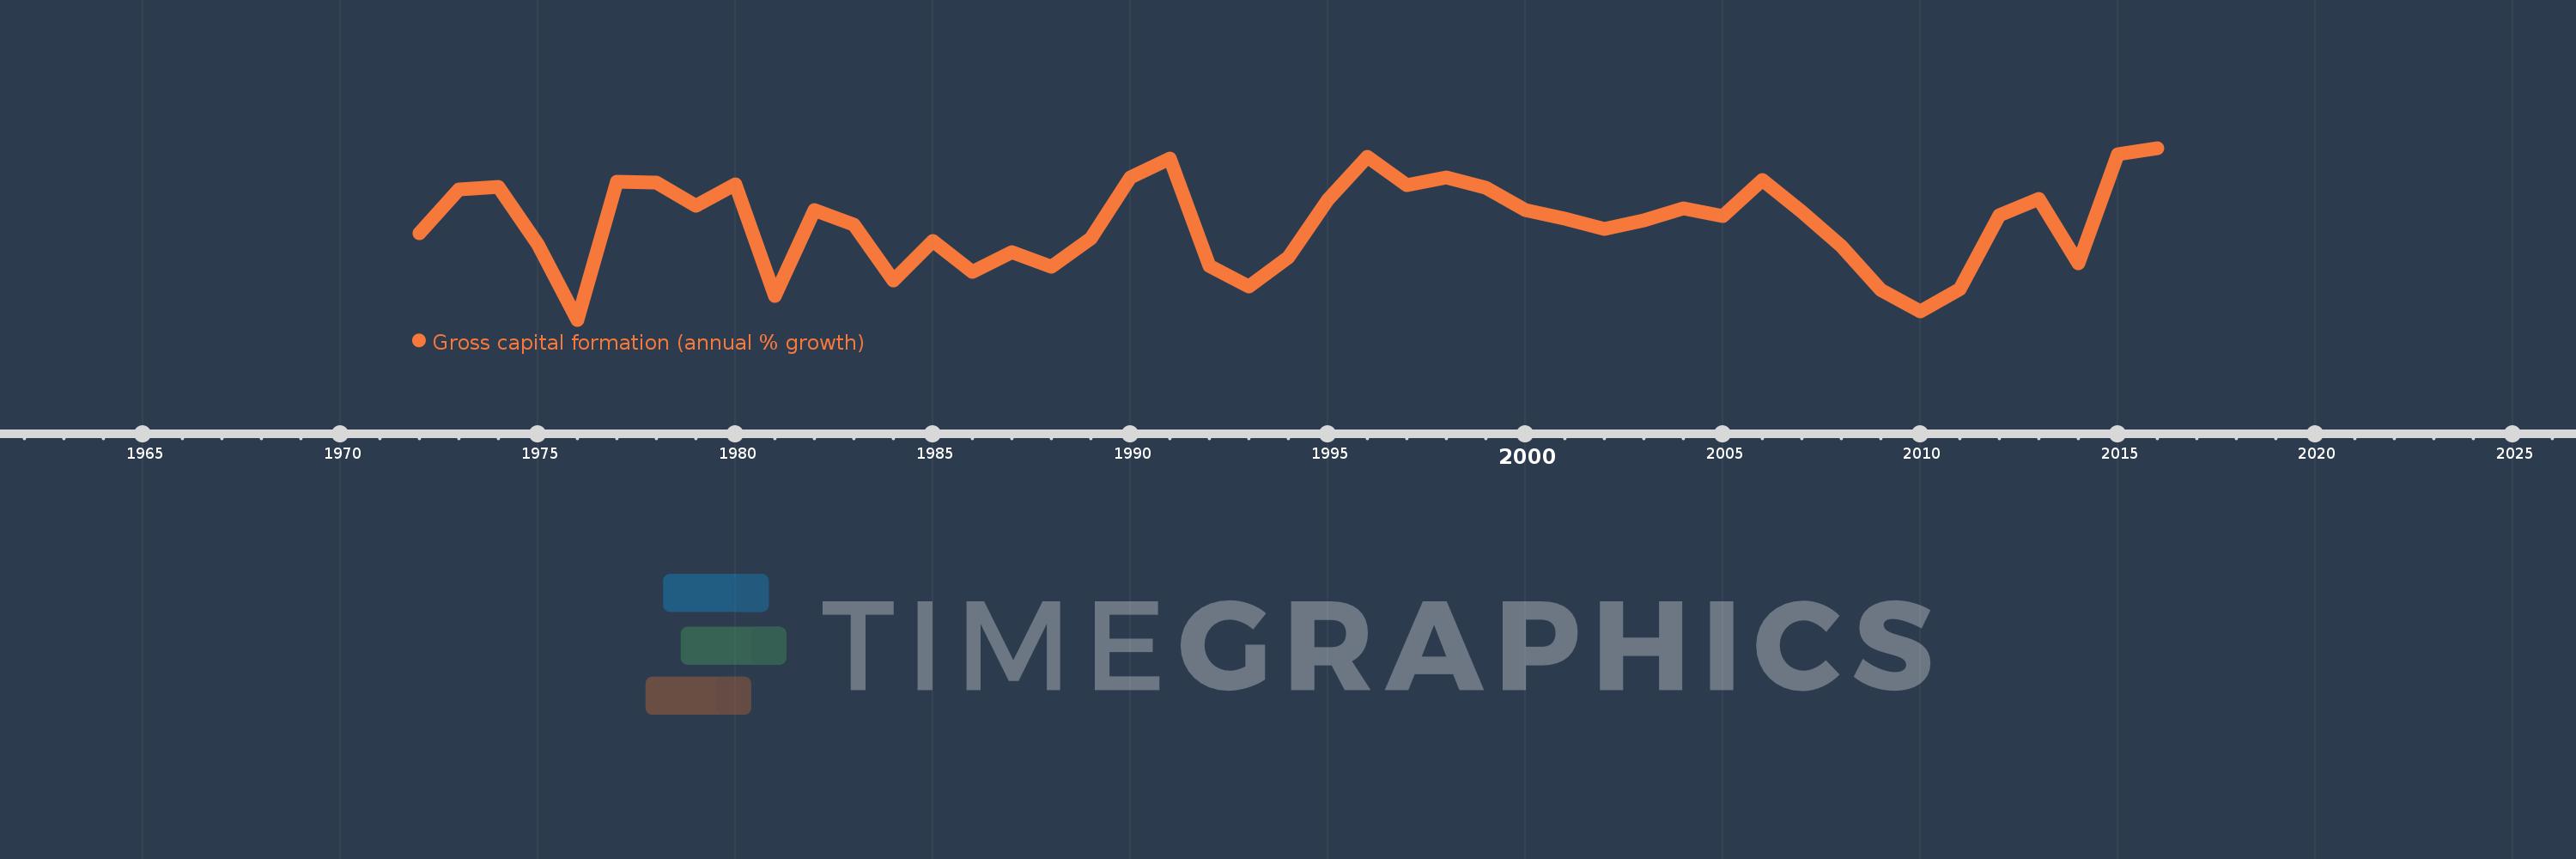
Gross capital formation (annual % growth)
2016,2015,2014,2013,2012,2011,2010,2009,2008,2007,2006,2005,2004,2003,2002,2001,2000,1999,1998,1997,1996,1995,1994,1993,1992,1991,1990,1989,1988,1987,1986,1985,1984,1983,1982,1981,1980,1979,1978,1977,1976,1975,1974,1973,1972
This statistics in other country:
AlbaniaAlgeriaAntigua and BarbudaArab WorldArgentinaArmeniaAustraliaAustriaAzerbaijanBahamas, TheBahrainBangladeshBarbadosBelarusBelgiumBelizeBeninBhutanBoliviaBosnia and HerzegovinaBotswanaBrazilBrunei DarussalamBulgariaBurkina FasoBurundiCabo VerdeCambodiaCameroonCanadaCaribbean small statesCentral Europe and the BalticsChadChileChinaColombiaComorosCongo, Dem. Rep.Congo, Rep.Costa RicaCote d'IvoireCroatiaCubaCyprusCzech RepublicDenmarkDjiboutiDominican RepublicEarly-demographic dividendEast Asia & PacificEast Asia & Pacific (excluding high income)East Asia & Pacific (IDA & IBRD countries)EcuadorEgypt, Arab Rep.El SalvadorEquatorial GuineaEritreaEstoniaEthiopiaEuro areaEurope & Central AsiaEurope & Central Asia (excluding high income)Europe & Central Asia (IDA & IBRD countries)European UnionFijiFinlandFranceGabonGambia, TheGeorgiaGermanyGhanaGreeceGuatemalaGuineaGuinea-BissauHaitiHeavily indebted poor countries (HIPC)High incomeHondurasHong Kong SAR, ChinaHungaryIBRD onlyIcelandIDA & IBRD totalIDA blendIDA onlyIDA totalIndiaIndonesiaIran, Islamic Rep.IrelandIsraelItalyJamaicaJapanJordanKazakhstanKenyaKorea, Rep.KosovoKuwaitKyrgyz RepublicLao PDRLate-demographic dividendLatin America & Caribbean Latin America & Caribbean (excluding high income)Latin America & the Caribbean (IDA & IBRD countries)LatviaLeast developed countries: UN classificationLebanonLiberiaLithuaniaLow & middle incomeLow incomeLower middle incomeLuxembourgMacao SAR, ChinaMacedonia, FYRMadagascarMalawiMalaysiaMaliMaltaMauritaniaMauritiusMexicoMiddle East & North AfricaMiddle East & North Africa (excluding high income)Middle East & North Africa (IDA & IBRD countries)Middle incomeMoldovaMongoliaMontenegroMoroccoMozambiqueNamibiaNepalNetherlandsNew ZealandNicaraguaNigerNigeriaNorth AmericaNorwayOECD membersOmanOther small statesPakistanPanamaPapua New GuineaParaguayPeruPhilippinesPolandPortugalPost-demographic dividendPre-demographic dividendPuerto RicoQatarRomaniaRussian FederationRwandaSaudi ArabiaSenegalSerbiaSeychellesSierra LeoneSingaporeSlovak RepublicSloveniaSmall statesSomaliaSouth AfricaSouth AsiaSouth Asia (IDA & IBRD)South SudanSpainSri LankaSub-Saharan Africa Sub-Saharan Africa (excluding high income)Sub-Saharan Africa (IDA & IBRD countries)SudanSurinameSwazilandSwedenSwitzerlandSyrian Arab RepublicTajikistanTanzaniaThailandTimor-LesteTogoTrinidad and TobagoTunisiaTurkeyTurkmenistanUgandaUkraineUnited Arab EmiratesUnited KingdomUnited StatesUpper middle incomeUruguayUzbekistanVanuatuVenezuela, RBVietnamWest Bank and GazaWorldZimbabwe Timeline:
This timeline shows a graph from 1972 to 2016 of Ireland. No data until 1971. Number of actual observations by date: 45.
Source name:
World Development Indicators
Source organization:
World Bank national accounts data, and OECD National Accounts data files.
Categories, topics:
Economy & Growth
Last updated:
apr 23, 2017
Indicators value changes by year
Minimum:
-21.939
jan 1, 1976
Maximum:
26.685
jan 1, 2016
At the date of observation
Value
Absolute change
Change from previous value
jan 1, 1972
2.506
+2.506
0.0%
jan 1, 1973
15.063
+12.557
500.96%
jan 1, 1974
15.734
+0.671
4.46%
jan 1, 1975
-0.573
-16.307
-103.64%
jan 1, 1976
-21.939
-21.366
3.73K%
jan 1, 1977
17.228
+39.167
-178.53%
jan 1, 1978
16.866
-0.362
-2.1%
jan 1, 1979
10.281
-6.586
-39.05%
jan 1, 1980
16.378
+6.097
59.31%
jan 1, 1981
-15.248
-31.626
-193.1%
jan 1, 1982
9.208
+24.455
-160.39%
jan 1, 1983
5.065
-4.142
-44.99%
jan 1, 1984
-10.725
-15.79
-311.75%
jan 1, 1985
0.331
+11.056
-103.09%
jan 1, 1986
-8.456
-8.787
-2.65K%
jan 1, 1987
-2.842
+5.614
-66.39%
jan 1, 1988
-7.026
-4.183
147.16%
jan 1, 1989
1.153
+8.178
-116.41%
jan 1, 1990
18.304
+17.151
1.49K%
jan 1, 1991
23.772
+5.468
29.87%
jan 1, 1992
-6.664
-30.437
-128.03%
jan 1, 1993
-12.648
-5.984
89.79%
jan 1, 1994
-4.15
+8.499
-67.19%
jan 1, 1995
12.044
+16.194
-390.25%
jan 1, 1996
24.092
+12.048
100.03%
jan 1, 1997
16.059
-8.033
-33.34%
jan 1, 1998
18.462
+2.403
14.97%
jan 1, 1999
15.483
-2.979
-16.13%
jan 1, 2000
9.168
-6.316
-40.79%
jan 1, 2001
6.71
-2.457
-26.8%
jan 1, 2002
3.74
-2.971
-44.27%
jan 1, 2003
6.073
+2.333
62.39%
jan 1, 2004
9.484
+3.412
56.18%
jan 1, 2005
7.351
-2.133
-22.49%
jan 1, 2006
17.73
+10.379
141.18%
jan 1, 2007
8.712
-9.018
-50.87%
jan 1, 2008
-1.102
-9.813
-112.65%
jan 1, 2009
-13.589
-12.487
1.13K%
jan 1, 2010
-19.465
-5.877
43.25%
jan 1, 2011
-13.143
+6.322
-32.48%
jan 1, 2012
7.551
+20.694
-157.45%
jan 1, 2013
12.269
+4.718
62.48%
jan 1, 2014
-6.049
-18.318
-149.3%
jan 1, 2015
24.928
+30.977
-512.13%
jan 1, 2016
26.685
+1.757
7.05%
Ranking of countries by current statistics by years


Comments: