29
/
en
AIzaSyAYiBZKx7MnpbEhh9jyipgxe19OcubqV5w
April 1, 2024
266883
Trinidad and Tobago
TTO
true
2
1
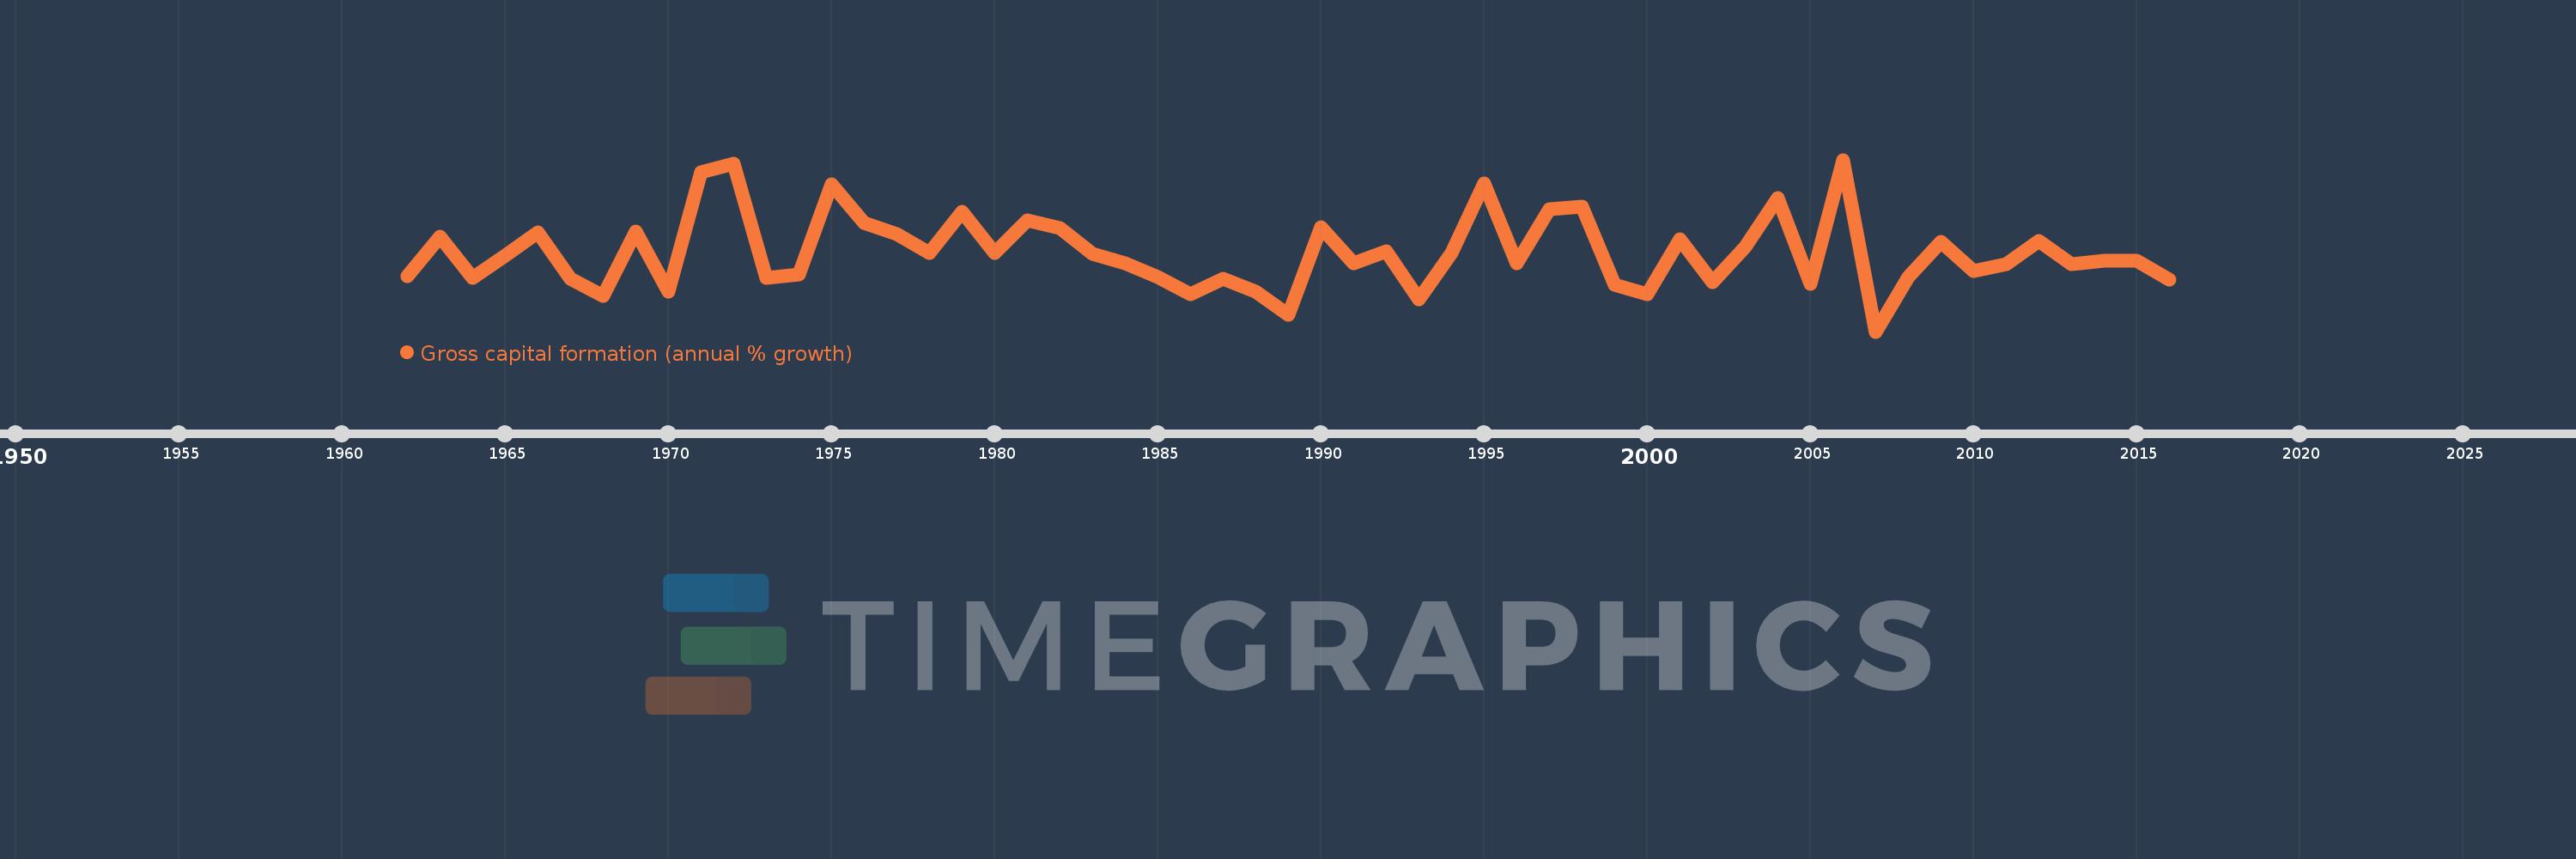
Gross capital formation (annual % growth)
2016,2015,2014,2013,2012,2011,2010,2009,2008,2007,2006,2005,2004,2003,2002,2001,2000,1999,1998,1997,1996,1995,1994,1993,1992,1991,1990,1989,1988,1987,1986,1985,1984,1983,1982,1981,1980,1979,1978,1977,1976,1975,1974,1973,1972,1971,1970,1969,1968,1967,1966,1965,1964,1963,1962
This statistics in other country:
AlbaniaAlgeriaAntigua and BarbudaArab WorldArgentinaArmeniaAustraliaAustriaAzerbaijanBahamas, TheBahrainBangladeshBarbadosBelarusBelgiumBelizeBeninBhutanBoliviaBosnia and HerzegovinaBotswanaBrazilBrunei DarussalamBulgariaBurkina FasoBurundiCabo VerdeCambodiaCameroonCanadaCaribbean small statesCentral Europe and the BalticsChadChileChinaColombiaComorosCongo, Dem. Rep.Congo, Rep.Costa RicaCote d'IvoireCroatiaCubaCyprusCzech RepublicDenmarkDjiboutiDominican RepublicEarly-demographic dividendEast Asia & PacificEast Asia & Pacific (excluding high income)East Asia & Pacific (IDA & IBRD countries)EcuadorEgypt, Arab Rep.El SalvadorEquatorial GuineaEritreaEstoniaEthiopiaEuro areaEurope & Central AsiaEurope & Central Asia (excluding high income)Europe & Central Asia (IDA & IBRD countries)European UnionFijiFinlandFranceGabonGambia, TheGeorgiaGermanyGhanaGreeceGuatemalaGuineaGuinea-BissauHaitiHeavily indebted poor countries (HIPC)High incomeHondurasHong Kong SAR, ChinaHungaryIBRD onlyIcelandIDA & IBRD totalIDA blendIDA onlyIDA totalIndiaIndonesiaIran, Islamic Rep.IrelandIsraelItalyJamaicaJapanJordanKazakhstanKenyaKorea, Rep.KosovoKuwaitKyrgyz RepublicLao PDRLate-demographic dividendLatin America & Caribbean Latin America & Caribbean (excluding high income)Latin America & the Caribbean (IDA & IBRD countries)LatviaLeast developed countries: UN classificationLebanonLiberiaLithuaniaLow & middle incomeLow incomeLower middle incomeLuxembourgMacao SAR, ChinaMacedonia, FYRMadagascarMalawiMalaysiaMaliMaltaMauritaniaMauritiusMexicoMiddle East & North AfricaMiddle East & North Africa (excluding high income)Middle East & North Africa (IDA & IBRD countries)Middle incomeMoldovaMongoliaMontenegroMoroccoMozambiqueNamibiaNepalNetherlandsNew ZealandNicaraguaNigerNigeriaNorth AmericaNorwayOECD membersOmanOther small statesPakistanPanamaPapua New GuineaParaguayPeruPhilippinesPolandPortugalPost-demographic dividendPre-demographic dividendPuerto RicoQatarRomaniaRussian FederationRwandaSaudi ArabiaSenegalSerbiaSeychellesSierra LeoneSingaporeSlovak RepublicSloveniaSmall statesSomaliaSouth AfricaSouth AsiaSouth Asia (IDA & IBRD)South SudanSpainSri LankaSub-Saharan Africa Sub-Saharan Africa (excluding high income)Sub-Saharan Africa (IDA & IBRD countries)SudanSurinameSwazilandSwedenSwitzerlandSyrian Arab RepublicTajikistanTanzaniaThailandTimor-LesteTogoTrinidad and TobagoTunisiaTurkeyTurkmenistanUgandaUkraineUnited Arab EmiratesUnited KingdomUnited StatesUpper middle incomeUruguayUzbekistanVanuatuVenezuela, RBVietnamWest Bank and GazaWorldZimbabwe Timeline:
This timeline shows a graph from 1962 to 2016 of Trinidad and Tobago. No data until 1961. Number of actual observations by date: 55.
Source name:
World Development Indicators
Source organization:
World Bank national accounts data, and OECD National Accounts data files.
Categories, topics:
Economy & Growth
Last updated:
apr 23, 2017
Indicators value changes by year
Minimum:
-44.181
jan 1, 2007
At the date of observation
Value
Absolute change
Change from previous value
jan 1, 1962
-10.804
-10.804
0.0%
jan 1, 1963
12.886
+23.691
-219.27%
jan 1, 1964
-12.1
-24.987
-193.9%
jan 1, 1965
1.299
+13.399
-110.73%
jan 1, 1966
15.641
+14.343
1.1K%
jan 1, 1967
-12.374
-28.015
-179.11%
jan 1, 1968
-22.976
-10.602
85.68%
jan 1, 1969
15.703
+38.679
-168.35%
jan 1, 1970
-20.358
-36.061
-229.64%
jan 1, 1971
51.515
+71.873
-353.05%
jan 1, 1972
56.871
+5.355
10.4%
jan 1, 1973
-11.939
-68.81
-120.99%
jan 1, 1974
-9.794
+2.146
-17.97%
jan 1, 1975
44.411
+54.205
-553.45%
jan 1, 1976
21.195
-23.216
-52.27%
jan 1, 1977
14.446
-6.749
-31.84%
jan 1, 1978
3.252
-11.194
-77.49%
jan 1, 1979
28.02
+24.767
761.54%
jan 1, 1980
3.188
-24.832
-88.62%
jan 1, 1981
22.614
+19.426
609.38%
jan 1, 1982
17.788
-4.826
-21.34%
jan 1, 1983
2.631
-15.157
-85.21%
jan 1, 1984
-2.961
-5.591
-212.53%
jan 1, 1985
-11.268
-8.308
280.62%
jan 1, 1986
-21.802
-10.534
93.48%
jan 1, 1987
-12.458
+9.344
-42.86%
jan 1, 1988
-20.379
-7.921
63.58%
jan 1, 1989
-34.091
-13.712
67.28%
jan 1, 1990
18.39
+52.481
-153.94%
jan 1, 1991
-2.989
-21.379
-116.25%
jan 1, 1992
4.071
+7.06
-236.2%
jan 1, 1993
-24.804
-28.875
-709.31%
jan 1, 1994
2.958
+27.762
-111.93%
jan 1, 1995
44.739
+41.781
1.41K%
jan 1, 1996
-3.132
-47.871
-107.0%
jan 1, 1997
29.465
+32.597
-1.04K%
jan 1, 1998
31.042
+1.577
5.35%
jan 1, 1999
-16.315
-47.357
-152.56%
jan 1, 2000
-21.855
-5.54
33.95%
jan 1, 2001
11.396
+33.251
-152.15%
jan 1, 2002
-14.68
-26.076
-228.82%
jan 1, 2003
6.746
+21.426
-145.95%
jan 1, 2004
35.815
+29.069
430.89%
jan 1, 2005
-15.735
-51.55
-143.94%
jan 1, 2006
59.0
+74.735
-474.95%
jan 1, 2007
-44.181
-103.181
-174.88%
jan 1, 2008
-11.496
+32.686
-73.98%
jan 1, 2009
9.917
+21.413
-186.27%
jan 1, 2010
-8.009
-17.926
-180.75%
jan 1, 2011
-3.868
+4.141
-51.71%
jan 1, 2012
10.068
+13.936
-360.32%
jan 1, 2013
-3.479
-13.547
-134.56%
jan 1, 2014
-1.405
+2.074
-59.62%
jan 1, 2015
-1.876
-0.471
33.56%
jan 1, 2016
-13.025
-11.148
594.2%
Ranking of countries by current statistics by years


Comments: