29
/
en
AIzaSyAYiBZKx7MnpbEhh9jyipgxe19OcubqV5w
April 1, 2024
245632
South Africa
ZAF
true
2
1
Gross capital formation (annual % growth)
2016,2015,2014,2013,2012,2011,2010,2009,2008,2007,2006,2005,2004,2003,2002,2001,2000,1999,1998,1997,1996,1995,1994,1993,1992,1991,1990,1989,1988,1987,1986,1985,1984,1983,1982,1981,1980,1979,1978,1977,1976,1975,1974,1973,1972,1971,1970,1969,1968,1967,1966,1965,1964,1963,1962
This statistics in other country:
AlbaniaAlgeriaAntigua and BarbudaArab WorldArgentinaArmeniaAustraliaAustriaAzerbaijanBahamas, TheBahrainBangladeshBarbadosBelarusBelgiumBelizeBeninBhutanBoliviaBosnia and HerzegovinaBotswanaBrazilBrunei DarussalamBulgariaBurkina FasoBurundiCabo VerdeCambodiaCameroonCanadaCaribbean small statesCentral Europe and the BalticsChadChileChinaColombiaComorosCongo, Dem. Rep.Congo, Rep.Costa RicaCote d'IvoireCroatiaCubaCyprusCzech RepublicDenmarkDjiboutiDominican RepublicEarly-demographic dividendEast Asia & PacificEast Asia & Pacific (excluding high income)East Asia & Pacific (IDA & IBRD countries)EcuadorEgypt, Arab Rep.El SalvadorEquatorial GuineaEritreaEstoniaEthiopiaEuro areaEurope & Central AsiaEurope & Central Asia (excluding high income)Europe & Central Asia (IDA & IBRD countries)European UnionFijiFinlandFranceGabonGambia, TheGeorgiaGermanyGhanaGreeceGuatemalaGuineaGuinea-BissauHaitiHeavily indebted poor countries (HIPC)High incomeHondurasHong Kong SAR, ChinaHungaryIBRD onlyIcelandIDA & IBRD totalIDA blendIDA onlyIDA totalIndiaIndonesiaIran, Islamic Rep.IrelandIsraelItalyJamaicaJapanJordanKazakhstanKenyaKorea, Rep.KosovoKuwaitKyrgyz RepublicLao PDRLate-demographic dividendLatin America & Caribbean Latin America & Caribbean (excluding high income)Latin America & the Caribbean (IDA & IBRD countries)LatviaLeast developed countries: UN classificationLebanonLiberiaLithuaniaLow & middle incomeLow incomeLower middle incomeLuxembourgMacao SAR, ChinaMacedonia, FYRMadagascarMalawiMalaysiaMaliMaltaMauritaniaMauritiusMexicoMiddle East & North AfricaMiddle East & North Africa (excluding high income)Middle East & North Africa (IDA & IBRD countries)Middle incomeMoldovaMongoliaMontenegroMoroccoMozambiqueNamibiaNepalNetherlandsNew ZealandNicaraguaNigerNigeriaNorth AmericaNorwayOECD membersOmanOther small statesPakistanPanamaPapua New GuineaParaguayPeruPhilippinesPolandPortugalPost-demographic dividendPre-demographic dividendPuerto RicoQatarRomaniaRussian FederationRwandaSaudi ArabiaSenegalSerbiaSeychellesSierra LeoneSingaporeSlovak RepublicSloveniaSmall statesSomaliaSouth AfricaSouth AsiaSouth Asia (IDA & IBRD)South SudanSpainSri LankaSub-Saharan Africa Sub-Saharan Africa (excluding high income)Sub-Saharan Africa (IDA & IBRD countries)SudanSurinameSwazilandSwedenSwitzerlandSyrian Arab RepublicTajikistanTanzaniaThailandTimor-LesteTogoTrinidad and TobagoTunisiaTurkeyTurkmenistanUgandaUkraineUnited Arab EmiratesUnited KingdomUnited StatesUpper middle incomeUruguayUzbekistanVanuatuVenezuela, RBVietnamWest Bank and GazaWorldZimbabwe Timeline:
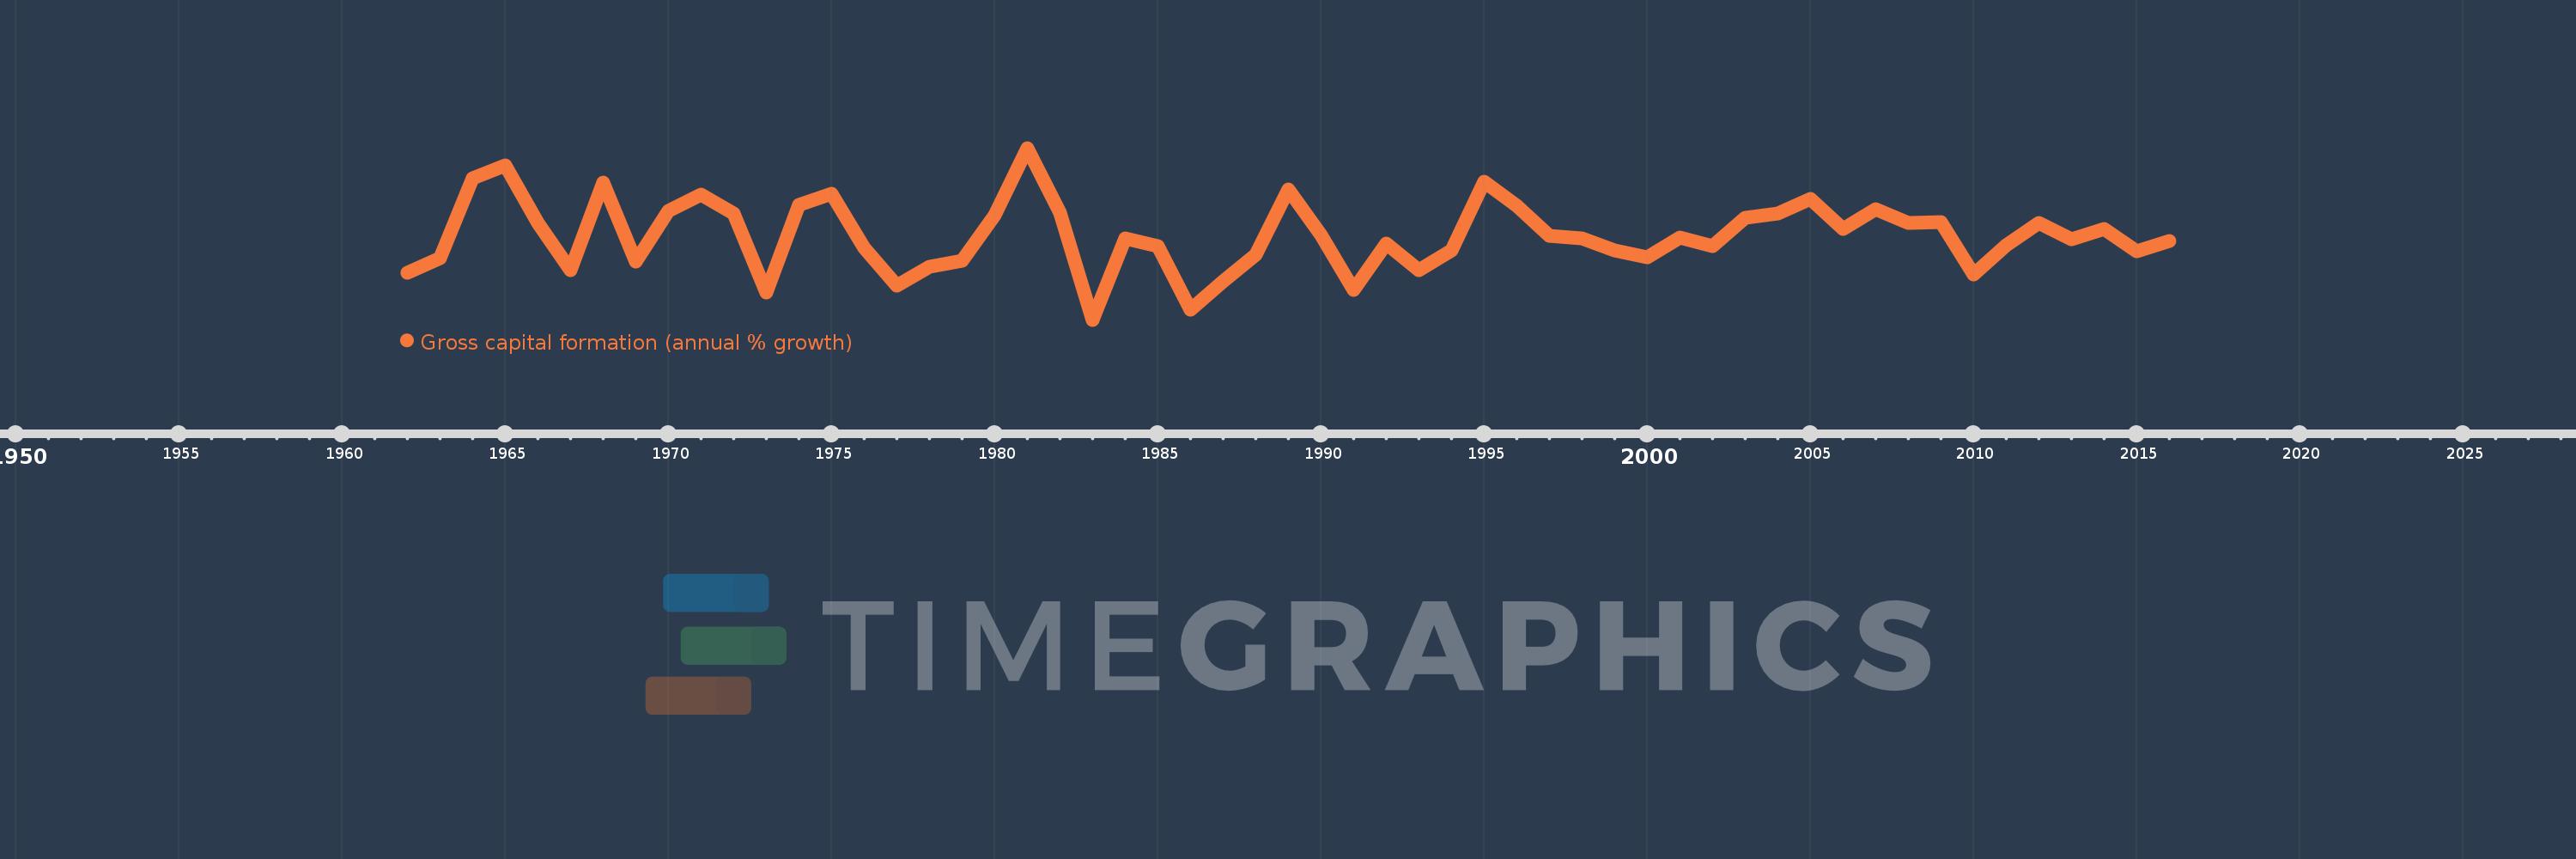
This timeline shows a graph from 1962 to 2016 of South Africa. No data until 1961. Number of actual observations by date: 55.
Source name:
World Development Indicators
Source organization:
World Bank national accounts data, and OECD National Accounts data files.
Categories, topics:
Economy & Growth
Last updated:
apr 23, 2017
Indicators value changes by year
Minimum:
-23.287
jan 1, 1983
At the date of observation
Value
Absolute change
Change from previous value
jan 1, 1962
-8.057
-8.057
0.0%
jan 1, 1963
-3.159
+4.898
-60.79%
jan 1, 1964
22.84
+25.998
-823.04%
jan 1, 1965
27.119
+4.28
18.74%
jan 1, 1966
8.283
-18.836
-69.46%
jan 1, 1967
-7.024
-15.307
-184.8%
jan 1, 1968
21.656
+28.68
-408.32%
jan 1, 1969
-4.269
-25.925
-119.71%
jan 1, 1970
12.272
+16.54
-387.48%
jan 1, 1971
17.529
+5.257
42.84%
jan 1, 1972
11.496
-6.033
-34.42%
jan 1, 1973
-14.297
-25.793
-224.37%
jan 1, 1974
14.284
+28.581
-199.91%
jan 1, 1975
17.994
+3.71
25.97%
jan 1, 1976
0.3
-17.694
-98.34%
jan 1, 1977
-12.054
-12.354
-4.12K%
jan 1, 1978
-5.924
+6.13
-50.85%
jan 1, 1979
-3.992
+1.933
-32.62%
jan 1, 1980
10.998
+14.989
-375.53%
jan 1, 1981
32.85
+21.853
198.7%
jan 1, 1982
11.641
-21.21
-64.56%
jan 1, 1983
-23.287
-34.928
-300.05%
jan 1, 1984
3.348
+26.635
-114.38%
jan 1, 1985
0.76
-2.588
-77.3%
jan 1, 1986
-19.916
-20.676
-2.72K%
jan 1, 1987
-10.714
+9.203
-46.21%
jan 1, 1988
-2.134
+8.58
-80.08%
jan 1, 1989
19.258
+21.392
-1.0K%
jan 1, 1990
4.514
-14.744
-76.56%
jan 1, 1991
-13.57
-18.084
-400.6%
jan 1, 1992
1.667
+15.237
-112.29%
jan 1, 1993
-6.995
-8.662
-519.59%
jan 1, 1994
-0.656
+6.339
-90.62%
jan 1, 1995
21.701
+22.357
-3.41K%
jan 1, 1996
13.858
-7.843
-36.14%
jan 1, 1997
4.073
-9.785
-70.61%
jan 1, 1998
3.216
-0.857
-21.04%
jan 1, 1999
-0.621
-3.837
-119.32%
jan 1, 2000
-2.785
-2.163
348.2%
jan 1, 2001
3.567
+6.352
-228.09%
jan 1, 2002
0.702
-2.865
-80.31%
jan 1, 2003
9.981
+9.278
1.32K%
jan 1, 2004
11.448
+1.467
14.7%
jan 1, 2005
16.14
+4.692
40.98%
jan 1, 2006
6.292
-9.848
-61.02%
jan 1, 2007
12.754
+6.462
102.71%
jan 1, 2008
8.407
-4.347
-34.08%
jan 1, 2009
8.615
+0.208
2.48%
jan 1, 2010
-8.504
-17.119
-198.72%
jan 1, 2011
1.124
+9.628
-113.21%
jan 1, 2012
8.238
+7.115
633.22%
jan 1, 2013
3.048
-5.19
-63.0%
jan 1, 2014
6.435
+3.386
111.1%
jan 1, 2015
-0.786
-7.221
-112.22%
jan 1, 2016
2.535
+3.322
-422.41%
Ranking of countries by current statistics by years


Comments: