29
/
en
AIzaSyAYiBZKx7MnpbEhh9jyipgxe19OcubqV5w
April 1, 2024
43459
Latin America & the Caribbean (IDA & IBRD countries)
TLA
false
2
1
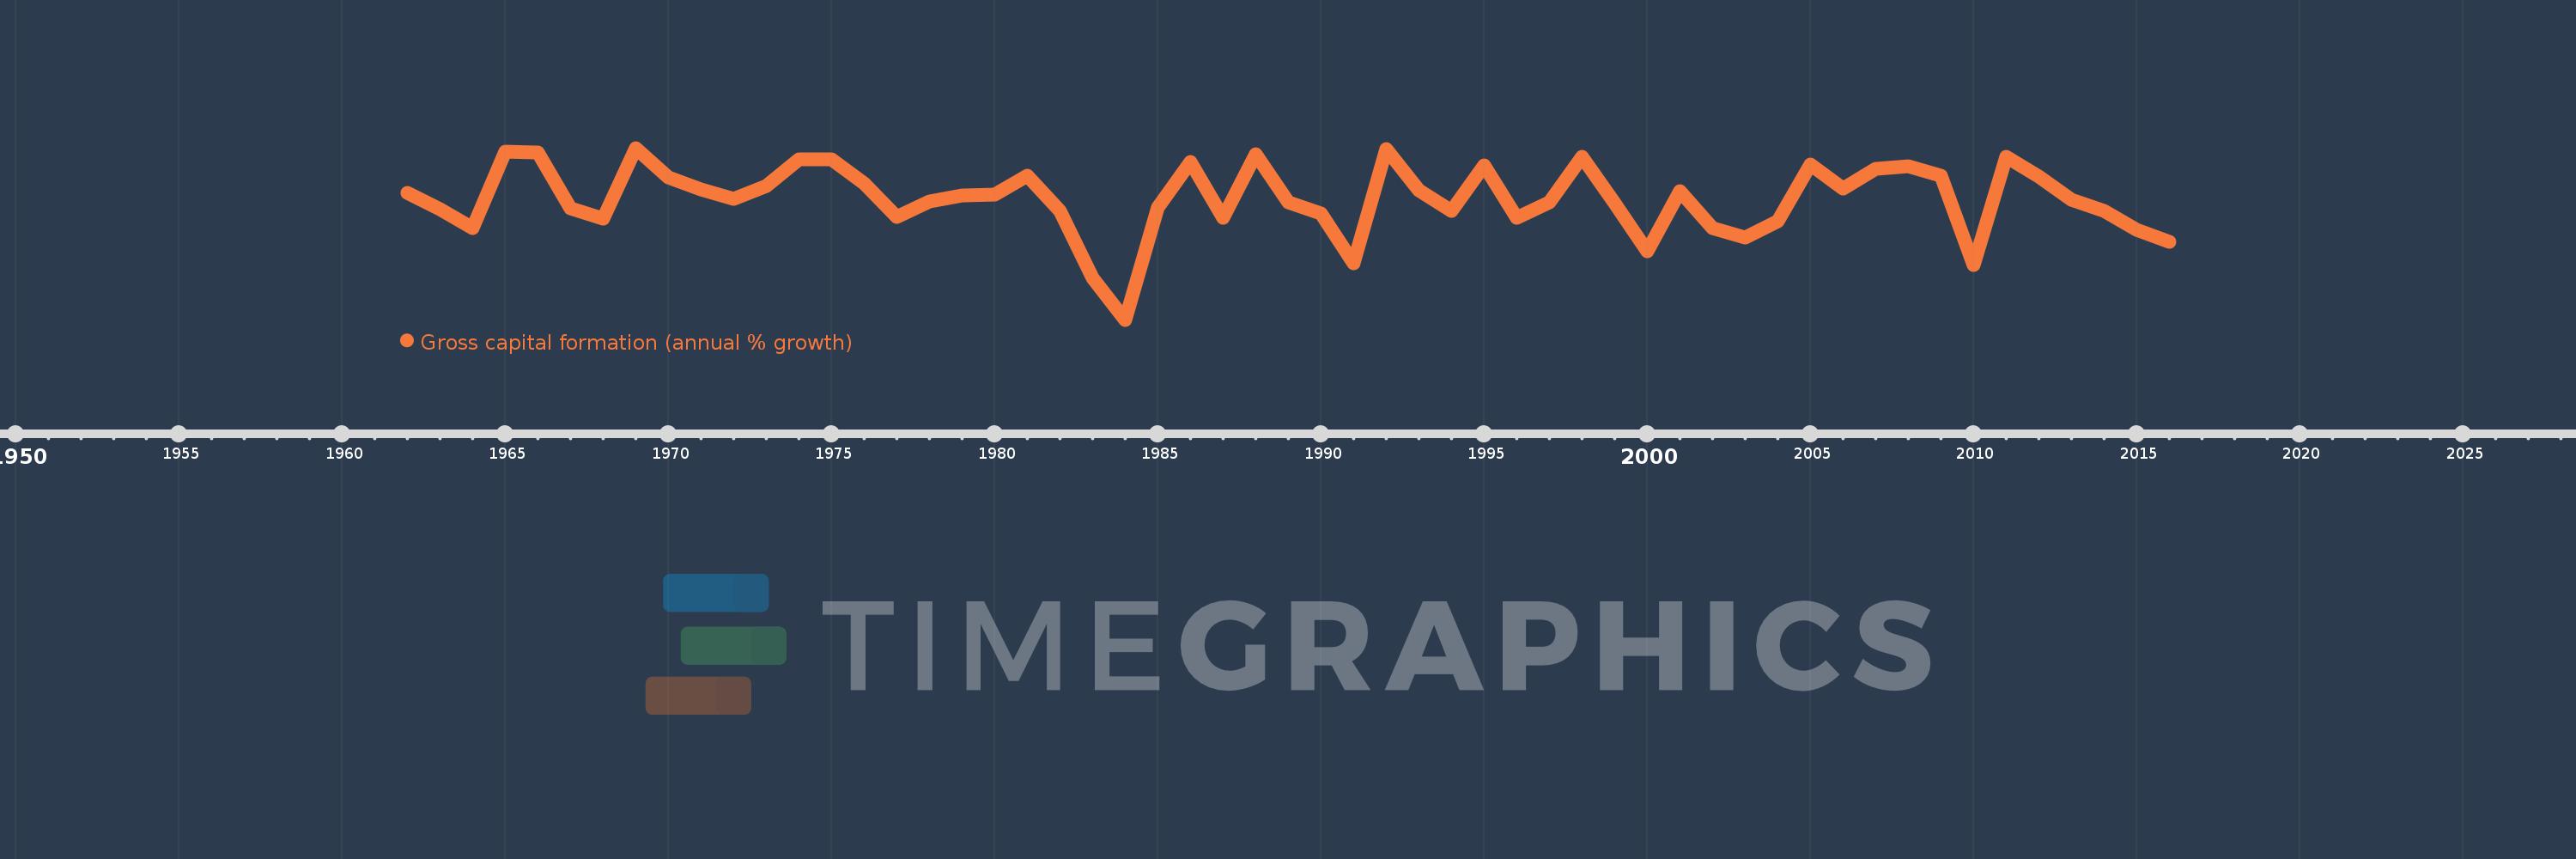
Gross capital formation (annual % growth)
2016,2015,2014,2013,2012,2011,2010,2009,2008,2007,2006,2005,2004,2003,2002,2001,2000,1999,1998,1997,1996,1995,1994,1993,1992,1991,1990,1989,1988,1987,1986,1985,1984,1983,1982,1981,1980,1979,1978,1977,1976,1975,1974,1973,1972,1971,1970,1969,1968,1967,1966,1965,1964,1963,1962
This statistics in other country:
AlbaniaAlgeriaAntigua and BarbudaArab WorldArgentinaArmeniaAustraliaAustriaAzerbaijanBahamas, TheBahrainBangladeshBarbadosBelarusBelgiumBelizeBeninBhutanBoliviaBosnia and HerzegovinaBotswanaBrazilBrunei DarussalamBulgariaBurkina FasoBurundiCabo VerdeCambodiaCameroonCanadaCaribbean small statesCentral Europe and the BalticsChadChileChinaColombiaComorosCongo, Dem. Rep.Congo, Rep.Costa RicaCote d'IvoireCroatiaCubaCyprusCzech RepublicDenmarkDjiboutiDominican RepublicEarly-demographic dividendEast Asia & PacificEast Asia & Pacific (excluding high income)East Asia & Pacific (IDA & IBRD countries)EcuadorEgypt, Arab Rep.El SalvadorEquatorial GuineaEritreaEstoniaEthiopiaEuro areaEurope & Central AsiaEurope & Central Asia (excluding high income)Europe & Central Asia (IDA & IBRD countries)European UnionFijiFinlandFranceGabonGambia, TheGeorgiaGermanyGhanaGreeceGuatemalaGuineaGuinea-BissauHaitiHeavily indebted poor countries (HIPC)High incomeHondurasHong Kong SAR, ChinaHungaryIBRD onlyIcelandIDA & IBRD totalIDA blendIDA onlyIDA totalIndiaIndonesiaIran, Islamic Rep.IrelandIsraelItalyJamaicaJapanJordanKazakhstanKenyaKorea, Rep.KosovoKuwaitKyrgyz RepublicLao PDRLate-demographic dividendLatin America & Caribbean Latin America & Caribbean (excluding high income)Latin America & the Caribbean (IDA & IBRD countries)LatviaLeast developed countries: UN classificationLebanonLiberiaLithuaniaLow & middle incomeLow incomeLower middle incomeLuxembourgMacao SAR, ChinaMacedonia, FYRMadagascarMalawiMalaysiaMaliMaltaMauritaniaMauritiusMexicoMiddle East & North AfricaMiddle East & North Africa (excluding high income)Middle East & North Africa (IDA & IBRD countries)Middle incomeMoldovaMongoliaMontenegroMoroccoMozambiqueNamibiaNepalNetherlandsNew ZealandNicaraguaNigerNigeriaNorth AmericaNorwayOECD membersOmanOther small statesPakistanPanamaPapua New GuineaParaguayPeruPhilippinesPolandPortugalPost-demographic dividendPre-demographic dividendPuerto RicoQatarRomaniaRussian FederationRwandaSaudi ArabiaSenegalSerbiaSeychellesSierra LeoneSingaporeSlovak RepublicSloveniaSmall statesSomaliaSouth AfricaSouth AsiaSouth Asia (IDA & IBRD)South SudanSpainSri LankaSub-Saharan Africa Sub-Saharan Africa (excluding high income)Sub-Saharan Africa (IDA & IBRD countries)SudanSurinameSwazilandSwedenSwitzerlandSyrian Arab RepublicTajikistanTanzaniaThailandTimor-LesteTogoTrinidad and TobagoTunisiaTurkeyTurkmenistanUgandaUkraineUnited Arab EmiratesUnited KingdomUnited StatesUpper middle incomeUruguayUzbekistanVanuatuVenezuela, RBVietnamWest Bank and GazaWorldZimbabwe Timeline:
This timeline shows a graph from 1962 to 2016 of Latin America & the Caribbean (IDA & IBRD countries). No data until 1961. Number of actual observations by date: 55.
Source name:
World Development Indicators
Source organization:
World Bank national accounts data, and OECD National Accounts data files.
Categories, topics:
Economy & Growth
Last updated:
apr 23, 2017
Indicators value changes by year
Minimum:
-23.421
jan 1, 1984
Maximum:
16.223
jan 1, 1969
At the date of observation
Value
Absolute change
Change from previous value
jan 1, 1962
5.869
+5.869
0.0%
jan 1, 1963
2.036
-3.833
-65.3%
jan 1, 1964
-2.187
-4.223
-207.42%
jan 1, 1965
15.429
+17.617
-805.44%
jan 1, 1966
15.191
-0.238
-1.55%
jan 1, 1967
2.238
-12.953
-85.27%
jan 1, 1968
-0.058
-2.296
-102.6%
jan 1, 1969
16.223
+16.281
-28.01K%
jan 1, 1970
9.401
-6.822
-42.05%
jan 1, 1971
6.629
-2.773
-29.49%
jan 1, 1972
4.458
-2.171
-32.75%
jan 1, 1973
7.344
+2.887
64.76%
jan 1, 1974
13.604
+6.259
85.22%
jan 1, 1975
13.657
+0.054
0.4%
jan 1, 1976
8.089
-5.569
-40.77%
jan 1, 1977
0.4
-7.689
-95.05%
jan 1, 1978
3.859
+3.459
864.65%
jan 1, 1979
5.314
+1.454
37.68%
jan 1, 1980
5.459
+0.146
2.74%
jan 1, 1981
9.85
+4.391
80.42%
jan 1, 1982
1.78
-8.07
-81.93%
jan 1, 1983
-13.785
-15.565
-874.52%
jan 1, 1984
-23.421
-9.636
69.9%
jan 1, 1985
2.469
+25.89
-110.54%
jan 1, 1986
13.045
+10.576
428.36%
jan 1, 1987
0.163
-12.882
-98.75%
jan 1, 1988
14.722
+14.56
8.95K%
jan 1, 1989
3.773
-10.949
-74.37%
jan 1, 1990
1.181
-2.592
-68.71%
jan 1, 1991
-10.437
-11.617
-984.06%
jan 1, 1992
15.926
+26.362
-252.6%
jan 1, 1993
6.378
-9.548
-59.95%
jan 1, 1994
1.67
-4.708
-73.82%
jan 1, 1995
12.263
+10.594
634.43%
jan 1, 1996
0.039
-12.224
-99.68%
jan 1, 1997
3.646
+3.607
9.14K%
jan 1, 1998
14.162
+10.516
288.4%
jan 1, 1999
3.431
-10.731
-75.77%
jan 1, 2000
-7.679
-11.11
-323.83%
jan 1, 2001
6.335
+14.014
-182.49%
jan 1, 2002
-2.228
-8.562
-135.17%
jan 1, 2003
-4.409
-2.181
97.9%
jan 1, 2004
-0.751
+3.657
-82.96%
jan 1, 2005
12.496
+13.248
-1.76K%
jan 1, 2006
6.924
-5.572
-44.59%
jan 1, 2007
11.43
+4.506
65.07%
jan 1, 2008
12.019
+0.589
5.15%
jan 1, 2009
9.874
-2.145
-17.85%
jan 1, 2010
-10.796
-20.669
-209.34%
jan 1, 2011
14.238
+25.034
-231.89%
jan 1, 2012
9.59
-4.648
-32.64%
jan 1, 2013
4.36
-5.23
-54.53%
jan 1, 2014
1.739
-2.621
-60.12%
jan 1, 2015
-2.689
-4.428
-254.62%
jan 1, 2016
-5.402
-2.713
100.92%
Ranking of countries by current statistics by years


Comments: