29
/
en
AIzaSyAYiBZKx7MnpbEhh9jyipgxe19OcubqV5w
April 1, 2024
54812
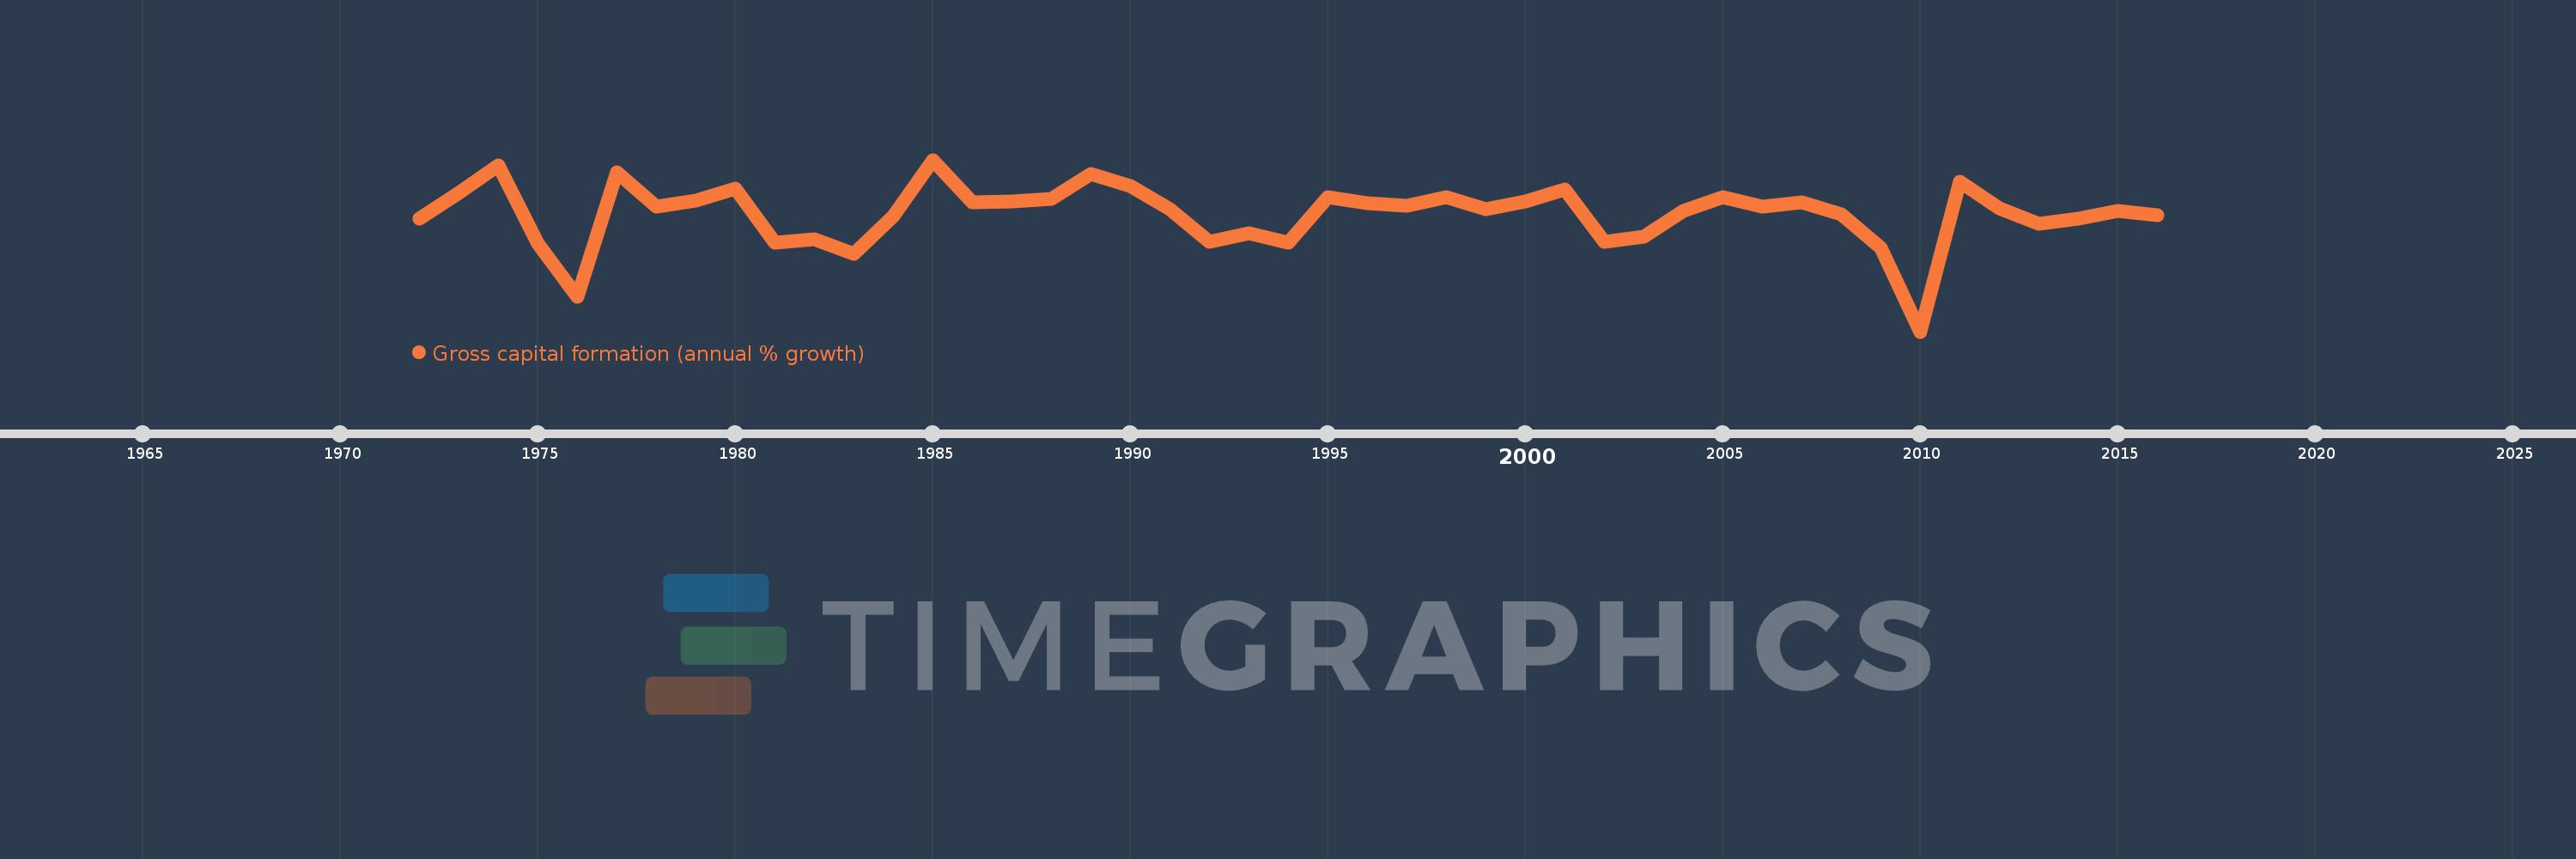
Post-demographic dividend
PST
false
2
1
Gross capital formation (annual % growth)
2016,2015,2014,2013,2012,2011,2010,2009,2008,2007,2006,2005,2004,2003,2002,2001,2000,1999,1998,1997,1996,1995,1994,1993,1992,1991,1990,1989,1988,1987,1986,1985,1984,1983,1982,1981,1980,1979,1978,1977,1976,1975,1974,1973,1972
This statistics in other country:
AlbaniaAlgeriaAntigua and BarbudaArab WorldArgentinaArmeniaAustraliaAustriaAzerbaijanBahamas, TheBahrainBangladeshBarbadosBelarusBelgiumBelizeBeninBhutanBoliviaBosnia and HerzegovinaBotswanaBrazilBrunei DarussalamBulgariaBurkina FasoBurundiCabo VerdeCambodiaCameroonCanadaCaribbean small statesCentral Europe and the BalticsChadChileChinaColombiaComorosCongo, Dem. Rep.Congo, Rep.Costa RicaCote d'IvoireCroatiaCubaCyprusCzech RepublicDenmarkDjiboutiDominican RepublicEarly-demographic dividendEast Asia & PacificEast Asia & Pacific (excluding high income)East Asia & Pacific (IDA & IBRD countries)EcuadorEgypt, Arab Rep.El SalvadorEquatorial GuineaEritreaEstoniaEthiopiaEuro areaEurope & Central AsiaEurope & Central Asia (excluding high income)Europe & Central Asia (IDA & IBRD countries)European UnionFijiFinlandFranceGabonGambia, TheGeorgiaGermanyGhanaGreeceGuatemalaGuineaGuinea-BissauHaitiHeavily indebted poor countries (HIPC)High incomeHondurasHong Kong SAR, ChinaHungaryIBRD onlyIcelandIDA & IBRD totalIDA blendIDA onlyIDA totalIndiaIndonesiaIran, Islamic Rep.IrelandIsraelItalyJamaicaJapanJordanKazakhstanKenyaKorea, Rep.KosovoKuwaitKyrgyz RepublicLao PDRLate-demographic dividendLatin America & Caribbean Latin America & Caribbean (excluding high income)Latin America & the Caribbean (IDA & IBRD countries)LatviaLeast developed countries: UN classificationLebanonLiberiaLithuaniaLow & middle incomeLow incomeLower middle incomeLuxembourgMacao SAR, ChinaMacedonia, FYRMadagascarMalawiMalaysiaMaliMaltaMauritaniaMauritiusMexicoMiddle East & North AfricaMiddle East & North Africa (excluding high income)Middle East & North Africa (IDA & IBRD countries)Middle incomeMoldovaMongoliaMontenegroMoroccoMozambiqueNamibiaNepalNetherlandsNew ZealandNicaraguaNigerNigeriaNorth AmericaNorwayOECD membersOmanOther small statesPakistanPanamaPapua New GuineaParaguayPeruPhilippinesPolandPortugalPost-demographic dividendPre-demographic dividendPuerto RicoQatarRomaniaRussian FederationRwandaSaudi ArabiaSenegalSerbiaSeychellesSierra LeoneSingaporeSlovak RepublicSloveniaSmall statesSomaliaSouth AfricaSouth AsiaSouth Asia (IDA & IBRD)South SudanSpainSri LankaSub-Saharan Africa Sub-Saharan Africa (excluding high income)Sub-Saharan Africa (IDA & IBRD countries)SudanSurinameSwazilandSwedenSwitzerlandSyrian Arab RepublicTajikistanTanzaniaThailandTimor-LesteTogoTrinidad and TobagoTunisiaTurkeyTurkmenistanUgandaUkraineUnited Arab EmiratesUnited KingdomUnited StatesUpper middle incomeUruguayUzbekistanVanuatuVenezuela, RBVietnamWest Bank and GazaWorldZimbabwe Timeline:
This timeline shows a graph from 1972 to 2016 of Post-demographic dividend. No data until 1971. Number of actual observations by date: 45.
Source name:
World Development Indicators
Source organization:
World Bank national accounts data, and OECD National Accounts data files.
Categories, topics:
Economy & Growth
Last updated:
apr 23, 2017
Indicators value changes by year
Minimum:
-15.546
jan 1, 2010
Maximum:
10.722
jan 1, 1985
At the date of observation
Value
Absolute change
Change from previous value
jan 1, 1972
1.765
+1.765
0.0%
jan 1, 1973
5.609
+3.843
217.74%
jan 1, 1974
9.859
+4.251
75.79%
jan 1, 1975
-2.101
-11.96
-121.31%
jan 1, 1976
-10.182
-8.081
384.66%
jan 1, 1977
8.831
+19.013
-186.73%
jan 1, 1978
3.54
-5.291
-59.91%
jan 1, 1979
4.471
+0.931
26.3%
jan 1, 1980
6.376
+1.905
42.6%
jan 1, 1981
-1.93
-8.307
-130.27%
jan 1, 1982
-1.372
+0.559
-28.94%
jan 1, 1983
-3.679
-2.307
168.18%
jan 1, 1984
2.18
+5.858
-159.26%
jan 1, 1985
10.722
+8.542
391.88%
jan 1, 1986
4.265
-6.457
-60.22%
jan 1, 1987
4.379
+0.114
2.67%
jan 1, 1988
4.752
+0.373
8.51%
jan 1, 1989
8.515
+3.763
79.19%
jan 1, 1990
6.697
-1.817
-21.34%
jan 1, 1991
3.12
-3.578
-53.42%
jan 1, 1992
-1.811
-4.931
-158.04%
jan 1, 1993
-0.519
+1.291
-71.32%
jan 1, 1994
-1.986
-1.467
282.49%
jan 1, 1995
4.951
+6.937
-349.26%
jan 1, 1996
4.047
-0.904
-18.25%
jan 1, 1997
3.676
-0.371
-9.17%
jan 1, 1998
4.995
+1.319
35.87%
jan 1, 1999
3.172
-1.823
-36.49%
jan 1, 2000
4.376
+1.204
37.97%
jan 1, 2001
6.199
+1.823
41.65%
jan 1, 2002
-1.835
-8.035
-129.6%
jan 1, 2003
-1.074
+0.761
-41.46%
jan 1, 2004
2.965
+4.04
-375.99%
jan 1, 2005
5.014
+2.049
69.1%
jan 1, 2006
3.569
-1.445
-28.83%
jan 1, 2007
4.244
+0.675
18.91%
jan 1, 2008
2.415
-1.829
-43.09%
jan 1, 2009
-2.76
-5.175
-214.3%
jan 1, 2010
-15.546
-12.786
463.18%
jan 1, 2011
7.349
+22.895
-147.28%
jan 1, 2012
3.283
-4.066
-55.33%
jan 1, 2013
0.987
-2.297
-69.95%
jan 1, 2014
1.727
+0.74
75.06%
jan 1, 2015
2.935
+1.208
69.96%
jan 1, 2016
2.262
-0.673
-22.93%
Ranking of countries by current statistics by years


Comments: