29
/
en
AIzaSyAYiBZKx7MnpbEhh9jyipgxe19OcubqV5w
April 1, 2024
282334
Vietnam
VNM
true
2
1
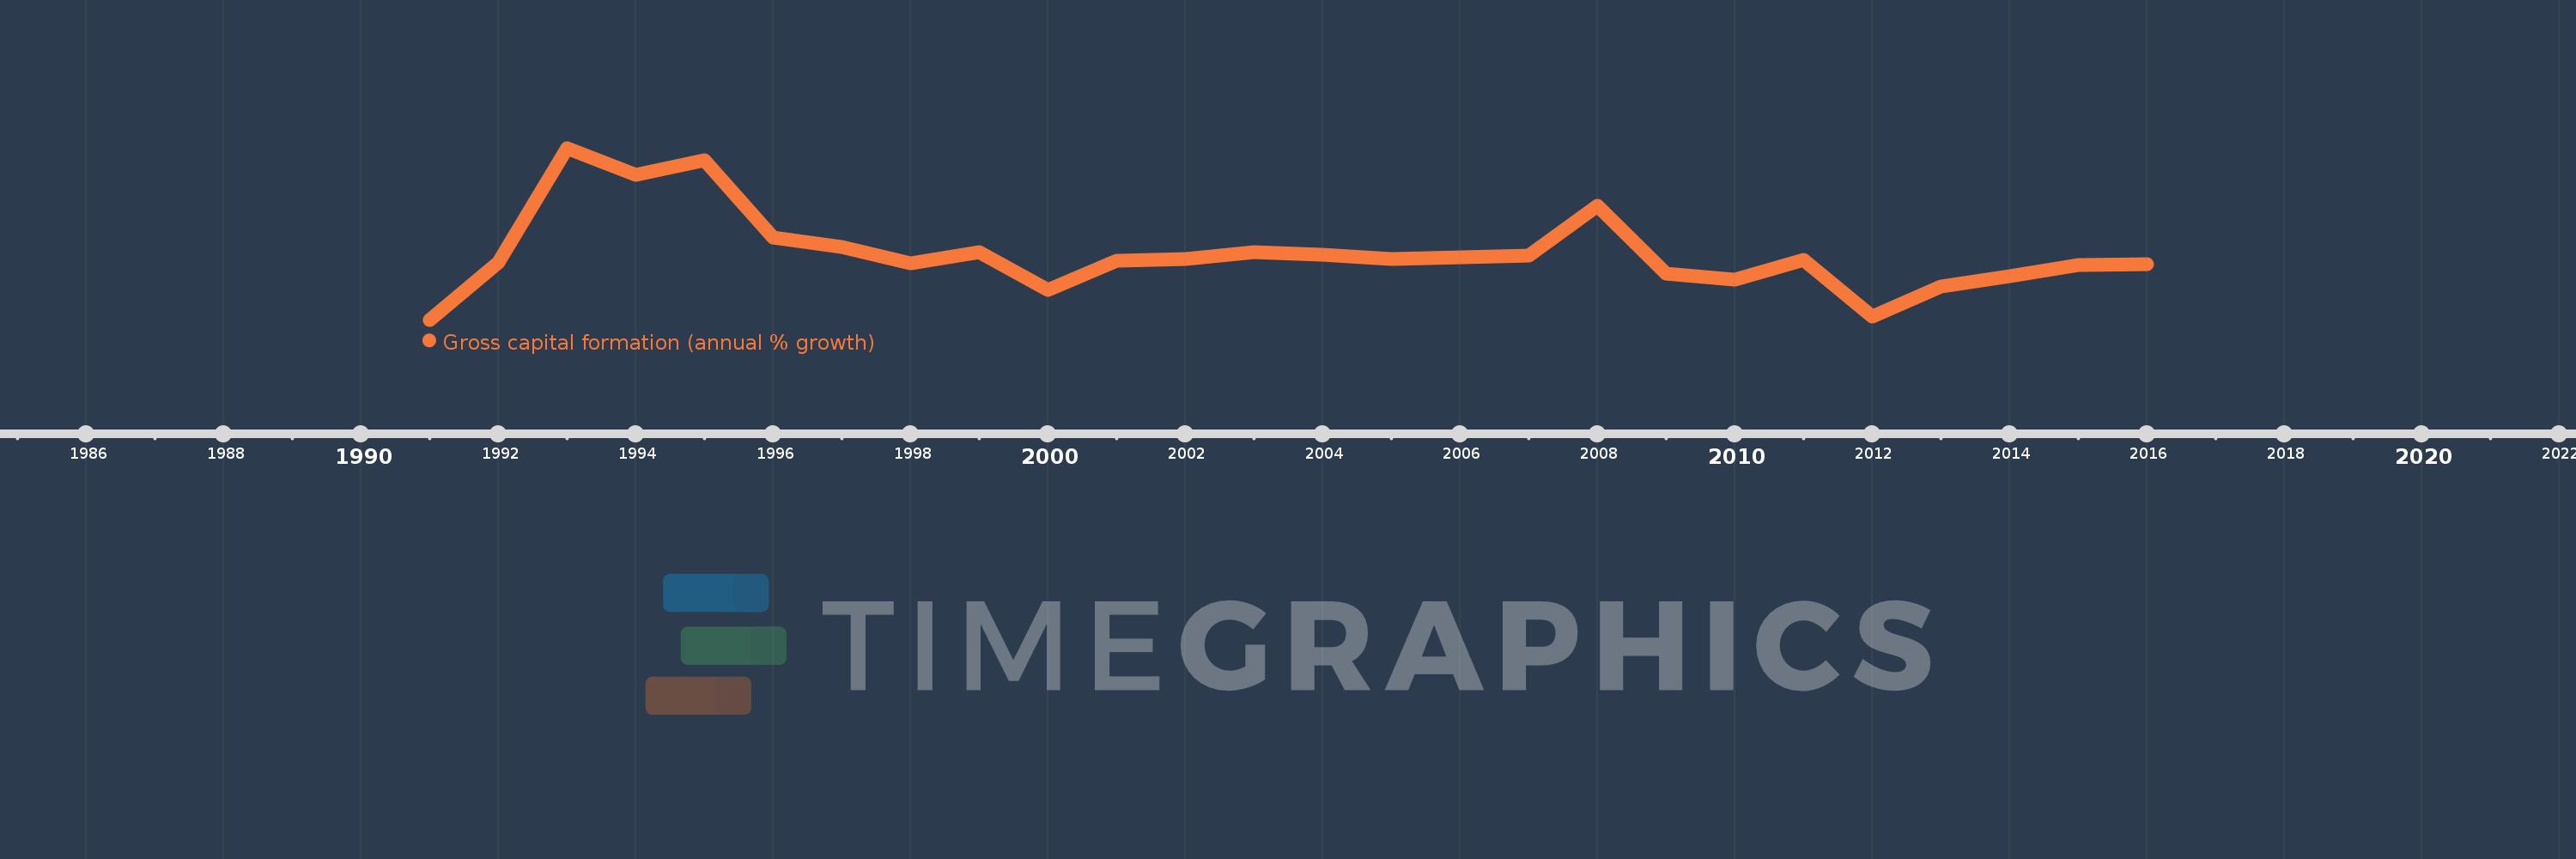
Gross capital formation (annual % growth)
2016,2015,2014,2013,2012,2011,2010,2009,2008,2007,2006,2005,2004,2003,2002,2001,2000,1999,1998,1997,1996,1995,1994,1993,1992,1991
This statistics in other country:
AlbaniaAlgeriaAntigua and BarbudaArab WorldArgentinaArmeniaAustraliaAustriaAzerbaijanBahamas, TheBahrainBangladeshBarbadosBelarusBelgiumBelizeBeninBhutanBoliviaBosnia and HerzegovinaBotswanaBrazilBrunei DarussalamBulgariaBurkina FasoBurundiCabo VerdeCambodiaCameroonCanadaCaribbean small statesCentral Europe and the BalticsChadChileChinaColombiaComorosCongo, Dem. Rep.Congo, Rep.Costa RicaCote d'IvoireCroatiaCubaCyprusCzech RepublicDenmarkDjiboutiDominican RepublicEarly-demographic dividendEast Asia & PacificEast Asia & Pacific (excluding high income)East Asia & Pacific (IDA & IBRD countries)EcuadorEgypt, Arab Rep.El SalvadorEquatorial GuineaEritreaEstoniaEthiopiaEuro areaEurope & Central AsiaEurope & Central Asia (excluding high income)Europe & Central Asia (IDA & IBRD countries)European UnionFijiFinlandFranceGabonGambia, TheGeorgiaGermanyGhanaGreeceGuatemalaGuineaGuinea-BissauHaitiHeavily indebted poor countries (HIPC)High incomeHondurasHong Kong SAR, ChinaHungaryIBRD onlyIcelandIDA & IBRD totalIDA blendIDA onlyIDA totalIndiaIndonesiaIran, Islamic Rep.IrelandIsraelItalyJamaicaJapanJordanKazakhstanKenyaKorea, Rep.KosovoKuwaitKyrgyz RepublicLao PDRLate-demographic dividendLatin America & Caribbean Latin America & Caribbean (excluding high income)Latin America & the Caribbean (IDA & IBRD countries)LatviaLeast developed countries: UN classificationLebanonLiberiaLithuaniaLow & middle incomeLow incomeLower middle incomeLuxembourgMacao SAR, ChinaMacedonia, FYRMadagascarMalawiMalaysiaMaliMaltaMauritaniaMauritiusMexicoMiddle East & North AfricaMiddle East & North Africa (excluding high income)Middle East & North Africa (IDA & IBRD countries)Middle incomeMoldovaMongoliaMontenegroMoroccoMozambiqueNamibiaNepalNetherlandsNew ZealandNicaraguaNigerNigeriaNorth AmericaNorwayOECD membersOmanOther small statesPakistanPanamaPapua New GuineaParaguayPeruPhilippinesPolandPortugalPost-demographic dividendPre-demographic dividendPuerto RicoQatarRomaniaRussian FederationRwandaSaudi ArabiaSenegalSerbiaSeychellesSierra LeoneSingaporeSlovak RepublicSloveniaSmall statesSomaliaSouth AfricaSouth AsiaSouth Asia (IDA & IBRD)South SudanSpainSri LankaSub-Saharan Africa Sub-Saharan Africa (excluding high income)Sub-Saharan Africa (IDA & IBRD countries)SudanSurinameSwazilandSwedenSwitzerlandSyrian Arab RepublicTajikistanTanzaniaThailandTimor-LesteTogoTrinidad and TobagoTunisiaTurkeyTurkmenistanUgandaUkraineUnited Arab EmiratesUnited KingdomUnited StatesUpper middle incomeUruguayUzbekistanVanuatuVenezuela, RBVietnamWest Bank and GazaWorldZimbabwe Timeline:
This timeline shows a graph from 1991 to 2016 of Vietnam. No data until 1990. Number of actual observations by date: 26.
Source name:
World Development Indicators
Source organization:
World Bank national accounts data, and OECD National Accounts data files.
Categories, topics:
Economy & Growth
Last updated:
apr 23, 2017
Indicators value changes by year
Minimum:
-7.693
jan 1, 1991
Maximum:
44.249
jan 1, 1993
At the date of observation
Value
Absolute change
Change from previous value
jan 1, 1991
-7.693
-7.693
0.0%
jan 1, 1992
9.541
+17.234
-224.03%
jan 1, 1993
44.249
+34.708
363.76%
jan 1, 1994
36.03
-8.219
-18.57%
jan 1, 1995
40.491
+4.46
12.38%
jan 1, 1996
17.075
-23.416
-57.83%
jan 1, 1997
14.229
-2.845
-16.66%
jan 1, 1998
9.376
-4.853
-34.11%
jan 1, 1999
12.629
+3.253
34.7%
jan 1, 2000
1.2
-11.429
-90.5%
jan 1, 2001
10.109
+8.91
742.62%
jan 1, 2002
10.768
+0.659
6.52%
jan 1, 2003
12.725
+1.957
18.17%
jan 1, 2004
11.862
-0.863
-6.78%
jan 1, 2005
10.541
-1.321
-11.14%
jan 1, 2006
11.151
+0.61
5.79%
jan 1, 2007
11.833
+0.683
6.12%
jan 1, 2008
26.799
+14.965
126.47%
jan 1, 2009
6.278
-20.52
-76.57%
jan 1, 2010
4.312
-1.966
-31.31%
jan 1, 2011
10.407
+6.094
141.32%
jan 1, 2012
-6.838
-17.245
-165.71%
jan 1, 2013
2.374
+9.212
-134.71%
jan 1, 2014
5.45
+3.077
129.61%
jan 1, 2015
8.9
+3.45
63.29%
jan 1, 2016
9.04
+0.14
1.57%
Ranking of countries by current statistics by years


Comments: