29
/
en
AIzaSyAYiBZKx7MnpbEhh9jyipgxe19OcubqV5w
April 1, 2024
210412
Nicaragua
NIC
true
2
1
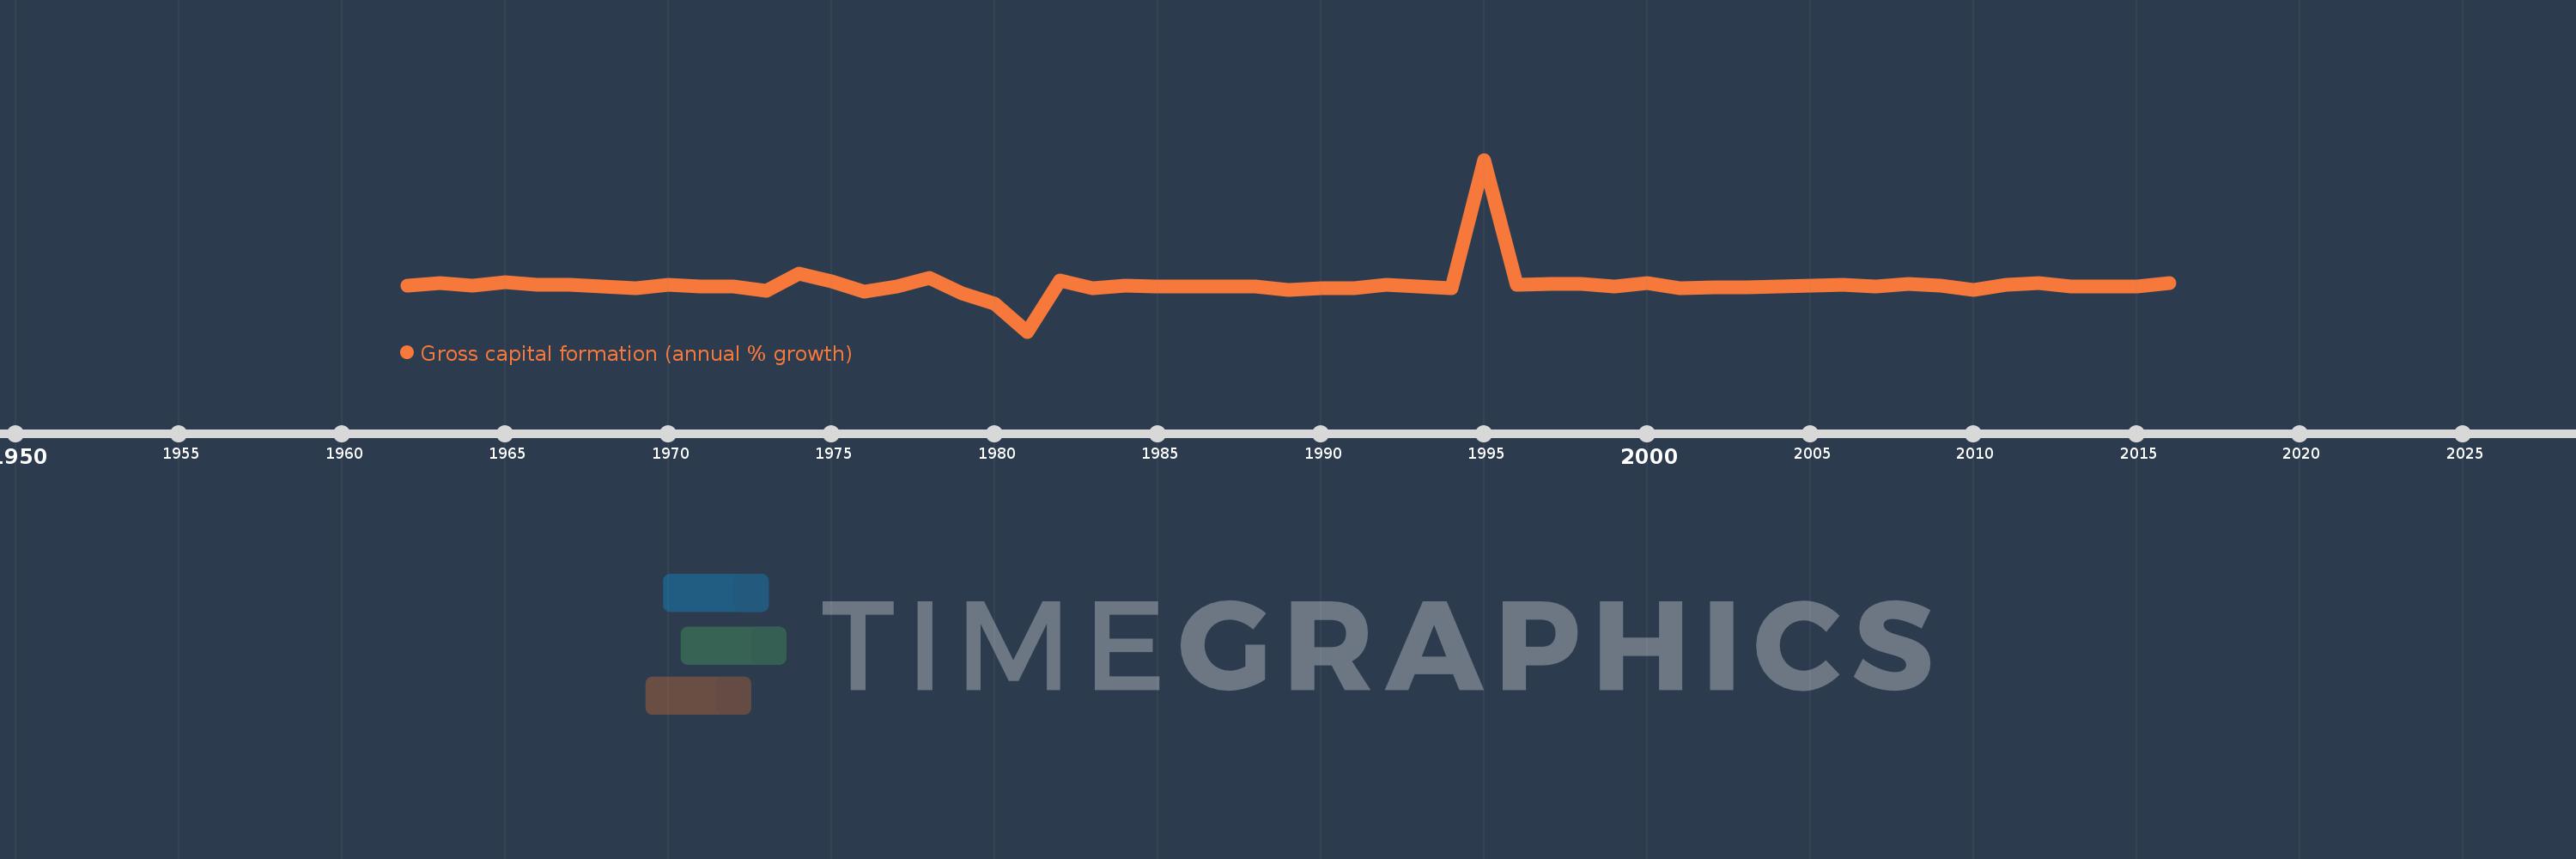
Gross capital formation (annual % growth)
2016,2015,2014,2013,2012,2011,2010,2009,2008,2007,2006,2005,2004,2003,2002,2001,2000,1999,1998,1997,1996,1995,1994,1993,1992,1991,1990,1989,1988,1987,1986,1985,1984,1983,1982,1981,1980,1979,1978,1977,1976,1975,1974,1973,1972,1971,1970,1969,1968,1967,1966,1965,1964,1963,1962
This statistics in other country:
AlbaniaAlgeriaAntigua and BarbudaArab WorldArgentinaArmeniaAustraliaAustriaAzerbaijanBahamas, TheBahrainBangladeshBarbadosBelarusBelgiumBelizeBeninBhutanBoliviaBosnia and HerzegovinaBotswanaBrazilBrunei DarussalamBulgariaBurkina FasoBurundiCabo VerdeCambodiaCameroonCanadaCaribbean small statesCentral Europe and the BalticsChadChileChinaColombiaComorosCongo, Dem. Rep.Congo, Rep.Costa RicaCote d'IvoireCroatiaCubaCyprusCzech RepublicDenmarkDjiboutiDominican RepublicEarly-demographic dividendEast Asia & PacificEast Asia & Pacific (excluding high income)East Asia & Pacific (IDA & IBRD countries)EcuadorEgypt, Arab Rep.El SalvadorEquatorial GuineaEritreaEstoniaEthiopiaEuro areaEurope & Central AsiaEurope & Central Asia (excluding high income)Europe & Central Asia (IDA & IBRD countries)European UnionFijiFinlandFranceGabonGambia, TheGeorgiaGermanyGhanaGreeceGuatemalaGuineaGuinea-BissauHaitiHeavily indebted poor countries (HIPC)High incomeHondurasHong Kong SAR, ChinaHungaryIBRD onlyIcelandIDA & IBRD totalIDA blendIDA onlyIDA totalIndiaIndonesiaIran, Islamic Rep.IrelandIsraelItalyJamaicaJapanJordanKazakhstanKenyaKorea, Rep.KosovoKuwaitKyrgyz RepublicLao PDRLate-demographic dividendLatin America & Caribbean Latin America & Caribbean (excluding high income)Latin America & the Caribbean (IDA & IBRD countries)LatviaLeast developed countries: UN classificationLebanonLiberiaLithuaniaLow & middle incomeLow incomeLower middle incomeLuxembourgMacao SAR, ChinaMacedonia, FYRMadagascarMalawiMalaysiaMaliMaltaMauritaniaMauritiusMexicoMiddle East & North AfricaMiddle East & North Africa (excluding high income)Middle East & North Africa (IDA & IBRD countries)Middle incomeMoldovaMongoliaMontenegroMoroccoMozambiqueNamibiaNepalNetherlandsNew ZealandNicaraguaNigerNigeriaNorth AmericaNorwayOECD membersOmanOther small statesPakistanPanamaPapua New GuineaParaguayPeruPhilippinesPolandPortugalPost-demographic dividendPre-demographic dividendPuerto RicoQatarRomaniaRussian FederationRwandaSaudi ArabiaSenegalSerbiaSeychellesSierra LeoneSingaporeSlovak RepublicSloveniaSmall statesSomaliaSouth AfricaSouth AsiaSouth Asia (IDA & IBRD)South SudanSpainSri LankaSub-Saharan Africa Sub-Saharan Africa (excluding high income)Sub-Saharan Africa (IDA & IBRD countries)SudanSurinameSwazilandSwedenSwitzerlandSyrian Arab RepublicTajikistanTanzaniaThailandTimor-LesteTogoTrinidad and TobagoTunisiaTurkeyTurkmenistanUgandaUkraineUnited Arab EmiratesUnited KingdomUnited StatesUpper middle incomeUruguayUzbekistanVanuatuVenezuela, RBVietnamWest Bank and GazaWorldZimbabwe Timeline:
This timeline shows a graph from 1962 to 2016 of Nicaragua. No data until 1961. Number of actual observations by date: 55.
Source name:
World Development Indicators
Source organization:
World Bank national accounts data, and OECD National Accounts data files.
Categories, topics:
Economy & Growth
Last updated:
apr 23, 2017
Indicators value changes by year
Minimum:
-376.223
jan 1, 1981
Maximum:
1.058K
jan 1, 1995
At the date of observation
Value
Absolute change
Change from previous value
jan 1, 1962
9.231
+9.231
0.0%
jan 1, 1963
28.873
+19.643
212.8%
jan 1, 1964
9.836
-19.037
-65.93%
jan 1, 1965
34.826
+24.99
254.06%
jan 1, 1966
16.052
-18.774
-53.91%
jan 1, 1967
12.597
-3.455
-21.52%
jan 1, 1968
-0.027
-12.623
-100.21%
jan 1, 1969
-12.73
-12.703
47.51K%
jan 1, 1970
15.036
+27.765
-218.12%
jan 1, 1971
1.163
-13.873
-92.26%
jan 1, 1972
3.294
+2.131
183.22%
jan 1, 1973
-33.018
-36.312
-1.1K%
jan 1, 1974
104.398
+137.416
-416.18%
jan 1, 1975
40.659
-63.739
-61.05%
jan 1, 1976
-40.807
-81.466
-200.36%
jan 1, 1977
2.37
+43.177
-105.81%
jan 1, 1978
71.087
+68.716
2.9K%
jan 1, 1979
-58.951
-130.037
-182.93%
jan 1, 1980
-143.665
-84.714
143.7%
jan 1, 1981
-376.223
-232.558
161.88%
jan 1, 1982
52.914
+429.137
-114.06%
jan 1, 1983
-17.587
-70.501
-133.24%
jan 1, 1984
8.731
+26.318
-149.65%
jan 1, 1985
0.878
-7.853
-89.94%
jan 1, 1986
-0.597
-1.475
-167.97%
jan 1, 1987
-1.235
-0.638
106.79%
jan 1, 1988
-1.539
-0.305
24.68%
jan 1, 1989
-29.4
-27.86
1.81K%
jan 1, 1990
-14.82
+14.579
-49.59%
jan 1, 1991
-14.168
+0.652
-4.4%
jan 1, 1992
15.672
+29.84
-210.61%
jan 1, 1993
-1.002
-16.674
-106.39%
jan 1, 1994
-14.908
-13.906
1.39K%
jan 1, 1995
1.058K
+1.073K
-7.2K%
jan 1, 1996
14.604
-1.044K
-98.62%
jan 1, 1997
20.755
+6.151
42.12%
jan 1, 1998
21.263
+0.509
2.45%
jan 1, 1999
3.362
-17.901
-84.19%
jan 1, 2000
30.64
+27.277
811.25%
jan 1, 2001
-16.85
-47.489
-154.99%
jan 1, 2002
-8.392
+8.458
-50.2%
jan 1, 2003
-7.095
+1.296
-15.45%
jan 1, 2004
-1.033
+6.062
-85.44%
jan 1, 2005
10.685
+11.718
-1.13K%
jan 1, 2006
11.319
+0.635
5.94%
jan 1, 2007
-0.142
-11.461
-101.25%
jan 1, 2008
20.543
+20.685
-14.57K%
jan 1, 2009
7.345
-13.199
-64.25%
jan 1, 2010
-29.057
-36.402
-495.6%
jan 1, 2011
16.525
+45.581
-156.87%
jan 1, 2012
29.157
+12.632
76.45%
jan 1, 2013
-0.126
-29.283
-100.43%
jan 1, 2014
0.291
+0.418
-330.7%
jan 1, 2015
-0.758
-1.049
-359.95%
jan 1, 2016
29.51
+30.268
-4.0K%
Ranking of countries by current statistics by years


Comments: