29
/
en
AIzaSyAYiBZKx7MnpbEhh9jyipgxe19OcubqV5w
April 1, 2024
87272
Bolivia
BOL
true
2
1
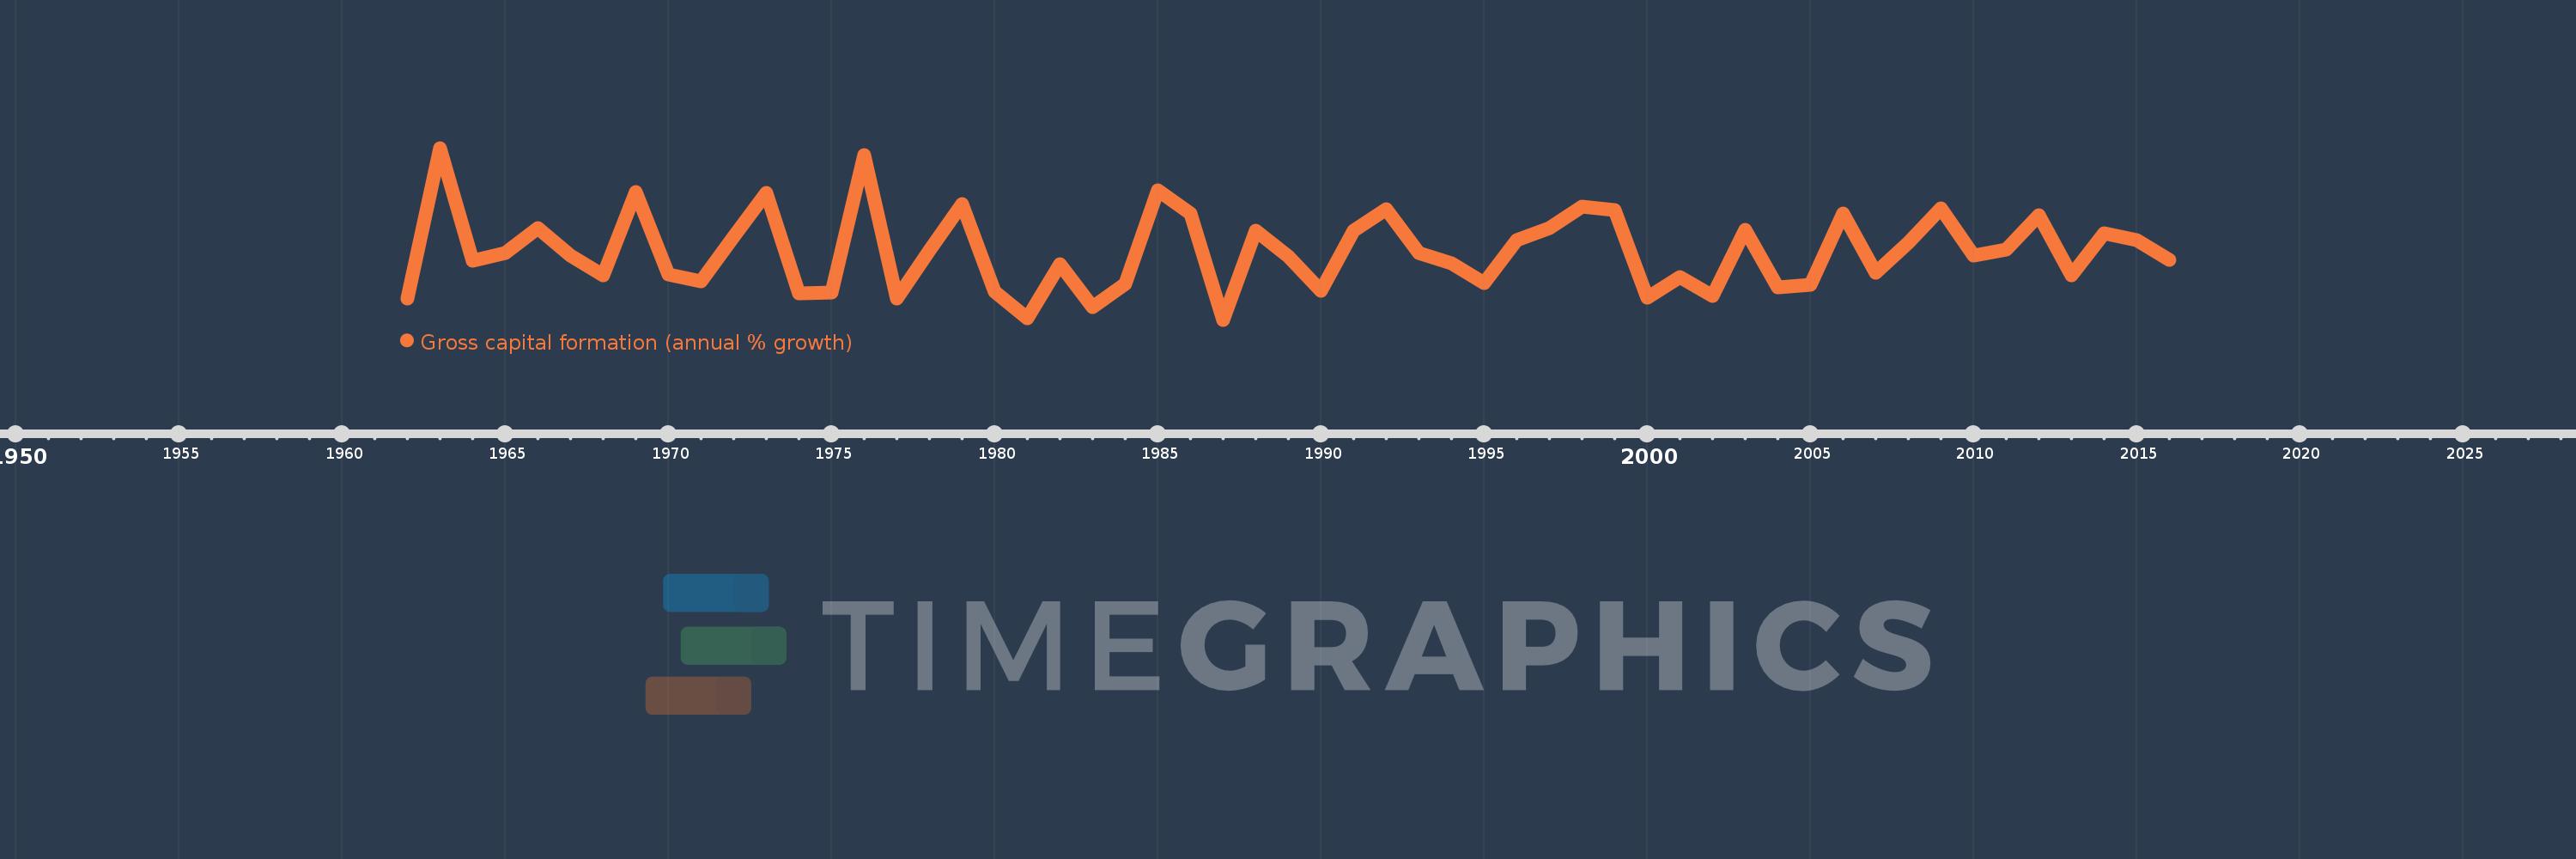
Gross capital formation (annual % growth)
2016,2015,2014,2013,2012,2011,2010,2009,2008,2007,2006,2005,2004,2003,2002,2001,2000,1999,1998,1997,1996,1995,1994,1993,1992,1991,1990,1989,1988,1987,1986,1985,1984,1983,1982,1981,1980,1979,1978,1977,1976,1975,1974,1973,1972,1971,1970,1969,1968,1967,1966,1965,1964,1963,1962
This statistics in other country:
AlbaniaAlgeriaAntigua and BarbudaArab WorldArgentinaArmeniaAustraliaAustriaAzerbaijanBahamas, TheBahrainBangladeshBarbadosBelarusBelgiumBelizeBeninBhutanBoliviaBosnia and HerzegovinaBotswanaBrazilBrunei DarussalamBulgariaBurkina FasoBurundiCabo VerdeCambodiaCameroonCanadaCaribbean small statesCentral Europe and the BalticsChadChileChinaColombiaComorosCongo, Dem. Rep.Congo, Rep.Costa RicaCote d'IvoireCroatiaCubaCyprusCzech RepublicDenmarkDjiboutiDominican RepublicEarly-demographic dividendEast Asia & PacificEast Asia & Pacific (excluding high income)East Asia & Pacific (IDA & IBRD countries)EcuadorEgypt, Arab Rep.El SalvadorEquatorial GuineaEritreaEstoniaEthiopiaEuro areaEurope & Central AsiaEurope & Central Asia (excluding high income)Europe & Central Asia (IDA & IBRD countries)European UnionFijiFinlandFranceGabonGambia, TheGeorgiaGermanyGhanaGreeceGuatemalaGuineaGuinea-BissauHaitiHeavily indebted poor countries (HIPC)High incomeHondurasHong Kong SAR, ChinaHungaryIBRD onlyIcelandIDA & IBRD totalIDA blendIDA onlyIDA totalIndiaIndonesiaIran, Islamic Rep.IrelandIsraelItalyJamaicaJapanJordanKazakhstanKenyaKorea, Rep.KosovoKuwaitKyrgyz RepublicLao PDRLate-demographic dividendLatin America & Caribbean Latin America & Caribbean (excluding high income)Latin America & the Caribbean (IDA & IBRD countries)LatviaLeast developed countries: UN classificationLebanonLiberiaLithuaniaLow & middle incomeLow incomeLower middle incomeLuxembourgMacao SAR, ChinaMacedonia, FYRMadagascarMalawiMalaysiaMaliMaltaMauritaniaMauritiusMexicoMiddle East & North AfricaMiddle East & North Africa (excluding high income)Middle East & North Africa (IDA & IBRD countries)Middle incomeMoldovaMongoliaMontenegroMoroccoMozambiqueNamibiaNepalNetherlandsNew ZealandNicaraguaNigerNigeriaNorth AmericaNorwayOECD membersOmanOther small statesPakistanPanamaPapua New GuineaParaguayPeruPhilippinesPolandPortugalPost-demographic dividendPre-demographic dividendPuerto RicoQatarRomaniaRussian FederationRwandaSaudi ArabiaSenegalSerbiaSeychellesSierra LeoneSingaporeSlovak RepublicSloveniaSmall statesSomaliaSouth AfricaSouth AsiaSouth Asia (IDA & IBRD)South SudanSpainSri LankaSub-Saharan Africa Sub-Saharan Africa (excluding high income)Sub-Saharan Africa (IDA & IBRD countries)SudanSurinameSwazilandSwedenSwitzerlandSyrian Arab RepublicTajikistanTanzaniaThailandTimor-LesteTogoTrinidad and TobagoTunisiaTurkeyTurkmenistanUgandaUkraineUnited Arab EmiratesUnited KingdomUnited StatesUpper middle incomeUruguayUzbekistanVanuatuVenezuela, RBVietnamWest Bank and GazaWorldZimbabwe Timeline:
This timeline shows a graph from 1962 to 2016 of Bolivia. No data until 1961. Number of actual observations by date: 55.
Source name:
World Development Indicators
Source organization:
World Bank national accounts data, and OECD National Accounts data files.
Categories, topics:
Economy & Growth
Last updated:
apr 23, 2017
Indicators value changes by year
Maximum:
62.055
jan 1, 1963
At the date of observation
Value
Absolute change
Change from previous value
jan 1, 1962
-19.04
-19.04
0.0%
jan 1, 1963
62.055
+81.095
-425.92%
jan 1, 1964
1.493
-60.563
-97.59%
jan 1, 1965
5.331
+3.838
257.17%
jan 1, 1966
19.023
+13.692
256.84%
jan 1, 1967
4.252
-14.77
-77.65%
jan 1, 1968
-6.54
-10.792
-253.8%
jan 1, 1969
38.149
+44.689
-683.31%
jan 1, 1970
-6.046
-44.195
-115.85%
jan 1, 1971
-9.608
-3.563
58.93%
jan 1, 1972
14.131
+23.739
-247.07%
jan 1, 1973
37.644
+23.514
166.4%
jan 1, 1974
-16.108
-53.752
-142.79%
jan 1, 1975
-15.981
+0.127
-0.79%
jan 1, 1976
58.396
+74.377
-465.42%
jan 1, 1977
-19.234
-77.63
-132.94%
jan 1, 1978
6.833
+26.066
-135.52%
jan 1, 1979
31.684
+24.852
363.73%
jan 1, 1980
-15.502
-47.186
-148.93%
jan 1, 1981
-29.838
-14.336
92.48%
jan 1, 1982
-0.781
+29.056
-97.38%
jan 1, 1983
-23.511
-22.73
2.91K%
jan 1, 1984
-11.14
+12.371
-52.62%
jan 1, 1985
39.294
+50.434
-452.74%
jan 1, 1986
26.823
-12.471
-31.74%
jan 1, 1987
-30.5
-57.323
-213.71%
jan 1, 1988
17.515
+48.015
-157.43%
jan 1, 1989
3.831
-13.684
-78.13%
jan 1, 1990
-15.12
-18.951
-494.68%
jan 1, 1991
17.684
+32.804
-216.96%
jan 1, 1992
29.287
+11.603
65.61%
jan 1, 1993
5.323
-23.964
-81.83%
jan 1, 1994
-0.069
-5.392
-101.3%
jan 1, 1995
-10.602
-10.533
15.24K%
jan 1, 1996
12.309
+22.911
-216.09%
jan 1, 1997
18.788
+6.479
52.64%
jan 1, 1998
30.234
+11.446
60.92%
jan 1, 1999
28.51
-1.723
-5.7%
jan 1, 2000
-18.762
-47.272
-165.81%
jan 1, 2001
-7.377
+11.385
-60.68%
jan 1, 2002
-17.469
-10.092
136.79%
jan 1, 2003
17.861
+35.33
-202.24%
jan 1, 2004
-12.828
-30.689
-171.82%
jan 1, 2005
-11.845
+0.983
-7.66%
jan 1, 2006
26.866
+38.711
-326.81%
jan 1, 2007
-5.09
-31.956
-118.95%
jan 1, 2008
11.041
+16.131
-316.9%
jan 1, 2009
29.32
+18.279
165.56%
jan 1, 2010
3.873
-25.446
-86.79%
jan 1, 2011
7.156
+3.283
84.76%
jan 1, 2012
25.852
+18.696
261.25%
jan 1, 2013
-6.591
-32.444
-125.5%
jan 1, 2014
16.041
+22.633
-343.37%
jan 1, 2015
12.497
-3.544
-22.1%
jan 1, 2016
1.557
-10.939
-87.54%
Ranking of countries by current statistics by years


Comments: