29
/
en
AIzaSyAYiBZKx7MnpbEhh9jyipgxe19OcubqV5w
April 1, 2024
59817
Sub-Saharan Africa (excluding high income)
SSA
false
2
1
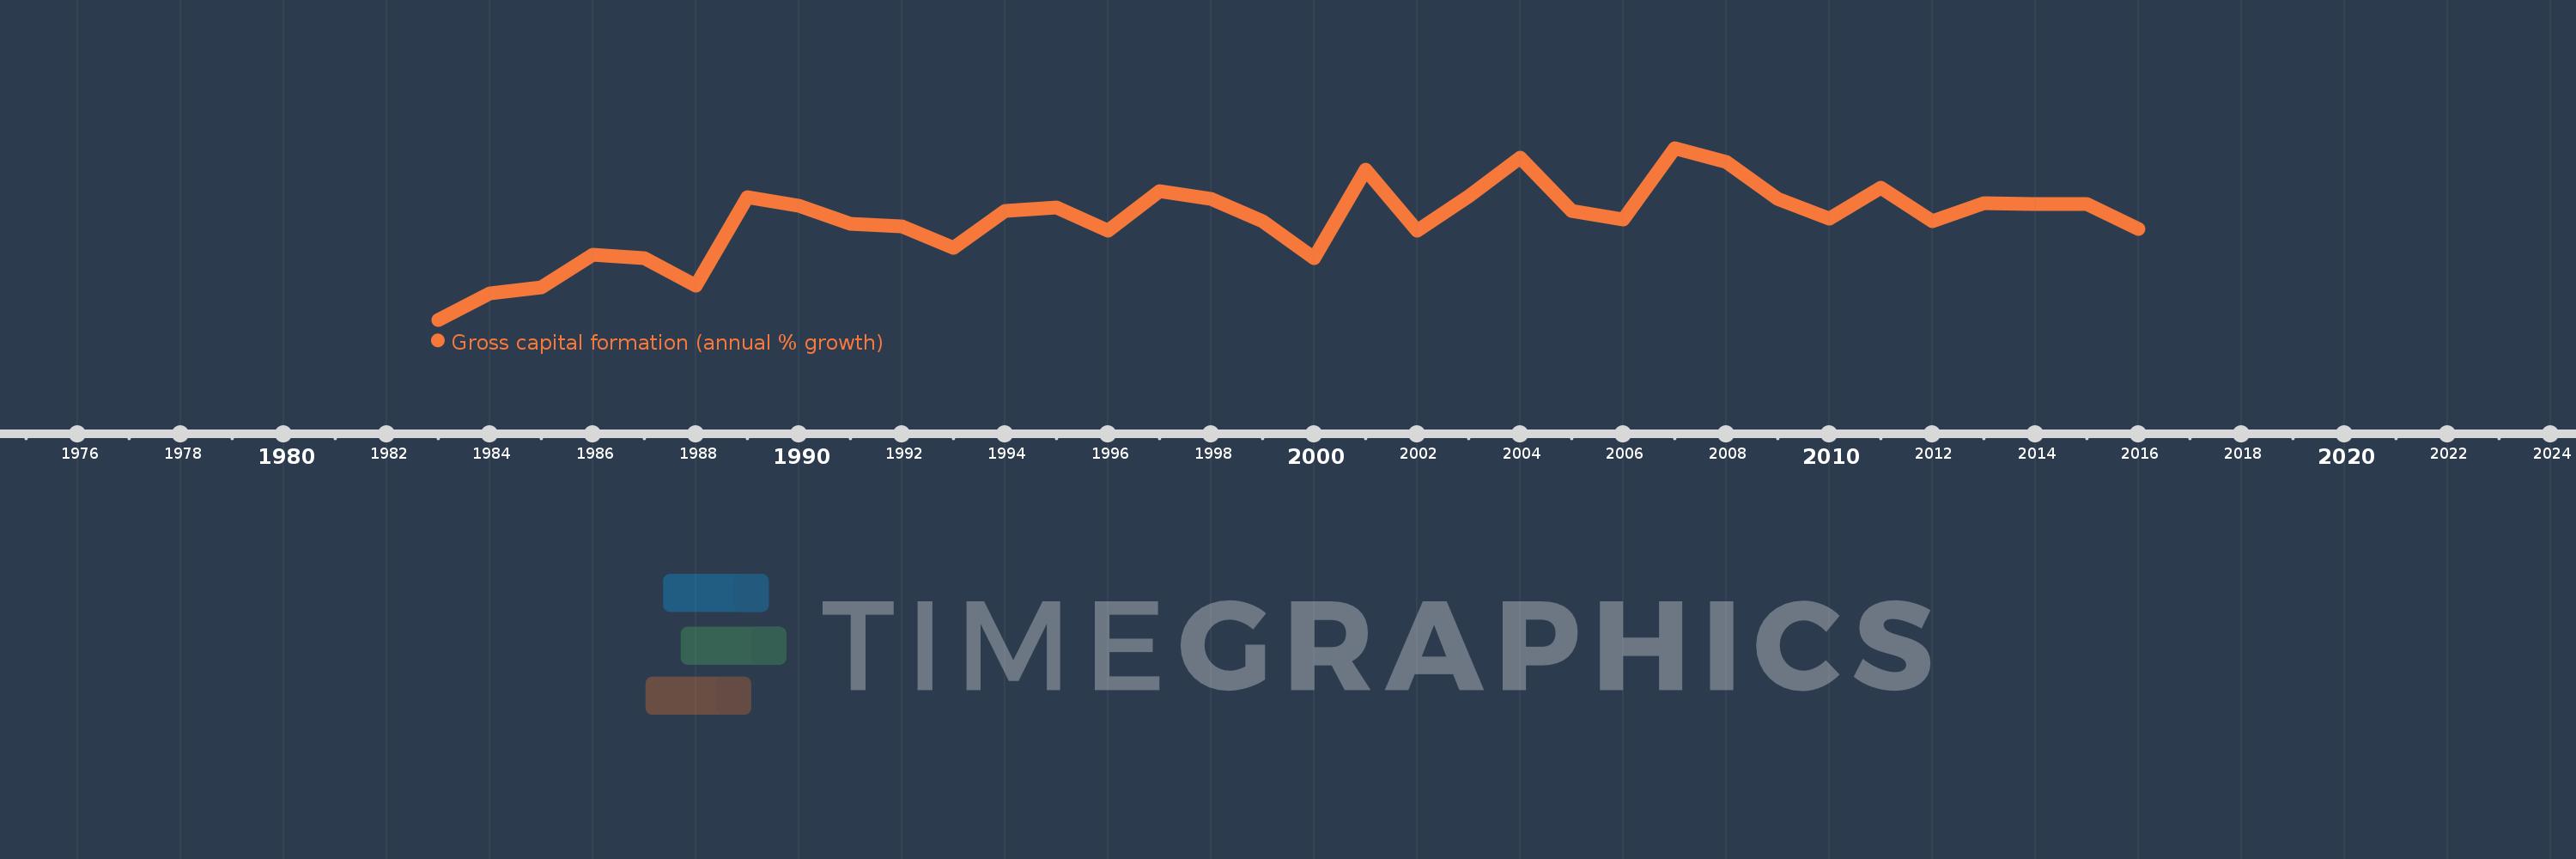
Gross capital formation (annual % growth)
2016,2015,2014,2013,2012,2011,2010,2009,2008,2007,2006,2005,2004,2003,2002,2001,2000,1999,1998,1997,1996,1995,1994,1993,1992,1991,1990,1989,1988,1987,1986,1985,1984,1983
This statistics in other country:
AlbaniaAlgeriaAntigua and BarbudaArab WorldArgentinaArmeniaAustraliaAustriaAzerbaijanBahamas, TheBahrainBangladeshBarbadosBelarusBelgiumBelizeBeninBhutanBoliviaBosnia and HerzegovinaBotswanaBrazilBrunei DarussalamBulgariaBurkina FasoBurundiCabo VerdeCambodiaCameroonCanadaCaribbean small statesCentral Europe and the BalticsChadChileChinaColombiaComorosCongo, Dem. Rep.Congo, Rep.Costa RicaCote d'IvoireCroatiaCubaCyprusCzech RepublicDenmarkDjiboutiDominican RepublicEarly-demographic dividendEast Asia & PacificEast Asia & Pacific (excluding high income)East Asia & Pacific (IDA & IBRD countries)EcuadorEgypt, Arab Rep.El SalvadorEquatorial GuineaEritreaEstoniaEthiopiaEuro areaEurope & Central AsiaEurope & Central Asia (excluding high income)Europe & Central Asia (IDA & IBRD countries)European UnionFijiFinlandFranceGabonGambia, TheGeorgiaGermanyGhanaGreeceGuatemalaGuineaGuinea-BissauHaitiHeavily indebted poor countries (HIPC)High incomeHondurasHong Kong SAR, ChinaHungaryIBRD onlyIcelandIDA & IBRD totalIDA blendIDA onlyIDA totalIndiaIndonesiaIran, Islamic Rep.IrelandIsraelItalyJamaicaJapanJordanKazakhstanKenyaKorea, Rep.KosovoKuwaitKyrgyz RepublicLao PDRLate-demographic dividendLatin America & Caribbean Latin America & Caribbean (excluding high income)Latin America & the Caribbean (IDA & IBRD countries)LatviaLeast developed countries: UN classificationLebanonLiberiaLithuaniaLow & middle incomeLow incomeLower middle incomeLuxembourgMacao SAR, ChinaMacedonia, FYRMadagascarMalawiMalaysiaMaliMaltaMauritaniaMauritiusMexicoMiddle East & North AfricaMiddle East & North Africa (excluding high income)Middle East & North Africa (IDA & IBRD countries)Middle incomeMoldovaMongoliaMontenegroMoroccoMozambiqueNamibiaNepalNetherlandsNew ZealandNicaraguaNigerNigeriaNorth AmericaNorwayOECD membersOmanOther small statesPakistanPanamaPapua New GuineaParaguayPeruPhilippinesPolandPortugalPost-demographic dividendPre-demographic dividendPuerto RicoQatarRomaniaRussian FederationRwandaSaudi ArabiaSenegalSerbiaSeychellesSierra LeoneSingaporeSlovak RepublicSloveniaSmall statesSomaliaSouth AfricaSouth AsiaSouth Asia (IDA & IBRD)South SudanSpainSri LankaSub-Saharan Africa Sub-Saharan Africa (excluding high income)Sub-Saharan Africa (IDA & IBRD countries)SudanSurinameSwazilandSwedenSwitzerlandSyrian Arab RepublicTajikistanTanzaniaThailandTimor-LesteTogoTrinidad and TobagoTunisiaTurkeyTurkmenistanUgandaUkraineUnited Arab EmiratesUnited KingdomUnited StatesUpper middle incomeUruguayUzbekistanVanuatuVenezuela, RBVietnamWest Bank and GazaWorldZimbabwe Timeline:
This timeline shows a graph from 1983 to 2016 of Sub-Saharan Africa (excluding high income). No data until 1982. Number of actual observations by date: 34.
Source name:
World Development Indicators
Source organization:
World Bank national accounts data, and OECD National Accounts data files.
Categories, topics:
Economy & Growth
Last updated:
apr 23, 2017
Indicators value changes by year
Minimum:
-21.389
jan 1, 1983
Maximum:
20.003
jan 1, 2007
At the date of observation
Value
Absolute change
Change from previous value
jan 1, 1983
-21.389
-21.389
0.0%
jan 1, 1984
-14.963
+6.426
-30.04%
jan 1, 1985
-13.568
+1.395
-9.33%
jan 1, 1986
-5.662
+7.906
-58.27%
jan 1, 1987
-6.548
-0.886
15.65%
jan 1, 1988
-13.113
-6.565
100.25%
jan 1, 1989
8.122
+21.235
-161.94%
jan 1, 1990
5.987
-2.135
-26.29%
jan 1, 1991
1.704
-4.283
-71.54%
jan 1, 1992
1.127
-0.577
-33.87%
jan 1, 1993
-4.066
-5.193
-460.83%
jan 1, 1994
4.807
+8.872
-218.22%
jan 1, 1995
5.613
+0.807
16.78%
jan 1, 1996
0.175
-5.438
-96.88%
jan 1, 1997
9.643
+9.468
5.41K%
jan 1, 1998
7.731
-1.912
-19.83%
jan 1, 1999
2.377
-5.354
-69.26%
jan 1, 2000
-6.546
-8.922
-375.4%
jan 1, 2001
14.788
+21.333
-325.91%
jan 1, 2002
0.024
-14.764
-99.84%
jan 1, 2003
8.442
+8.418
35.07K%
jan 1, 2004
17.655
+9.213
109.13%
jan 1, 2005
4.755
-12.9
-73.07%
jan 1, 2006
2.845
-1.911
-40.18%
jan 1, 2007
20.003
+17.158
603.19%
jan 1, 2008
16.548
-3.454
-17.27%
jan 1, 2009
7.649
-8.899
-53.78%
jan 1, 2010
2.959
-4.69
-61.31%
jan 1, 2011
10.336
+7.377
249.26%
jan 1, 2012
2.383
-7.954
-76.95%
jan 1, 2013
6.711
+4.328
181.66%
jan 1, 2014
6.528
-0.183
-2.73%
jan 1, 2015
6.501
-0.026
-0.4%
jan 1, 2016
0.471
-6.03
-92.76%
Ranking of countries by current statistics by years


Comments: