29
/
en
AIzaSyAYiBZKx7MnpbEhh9jyipgxe19OcubqV5w
April 1, 2024
182970
Macao SAR, China
MAC
true
2
1
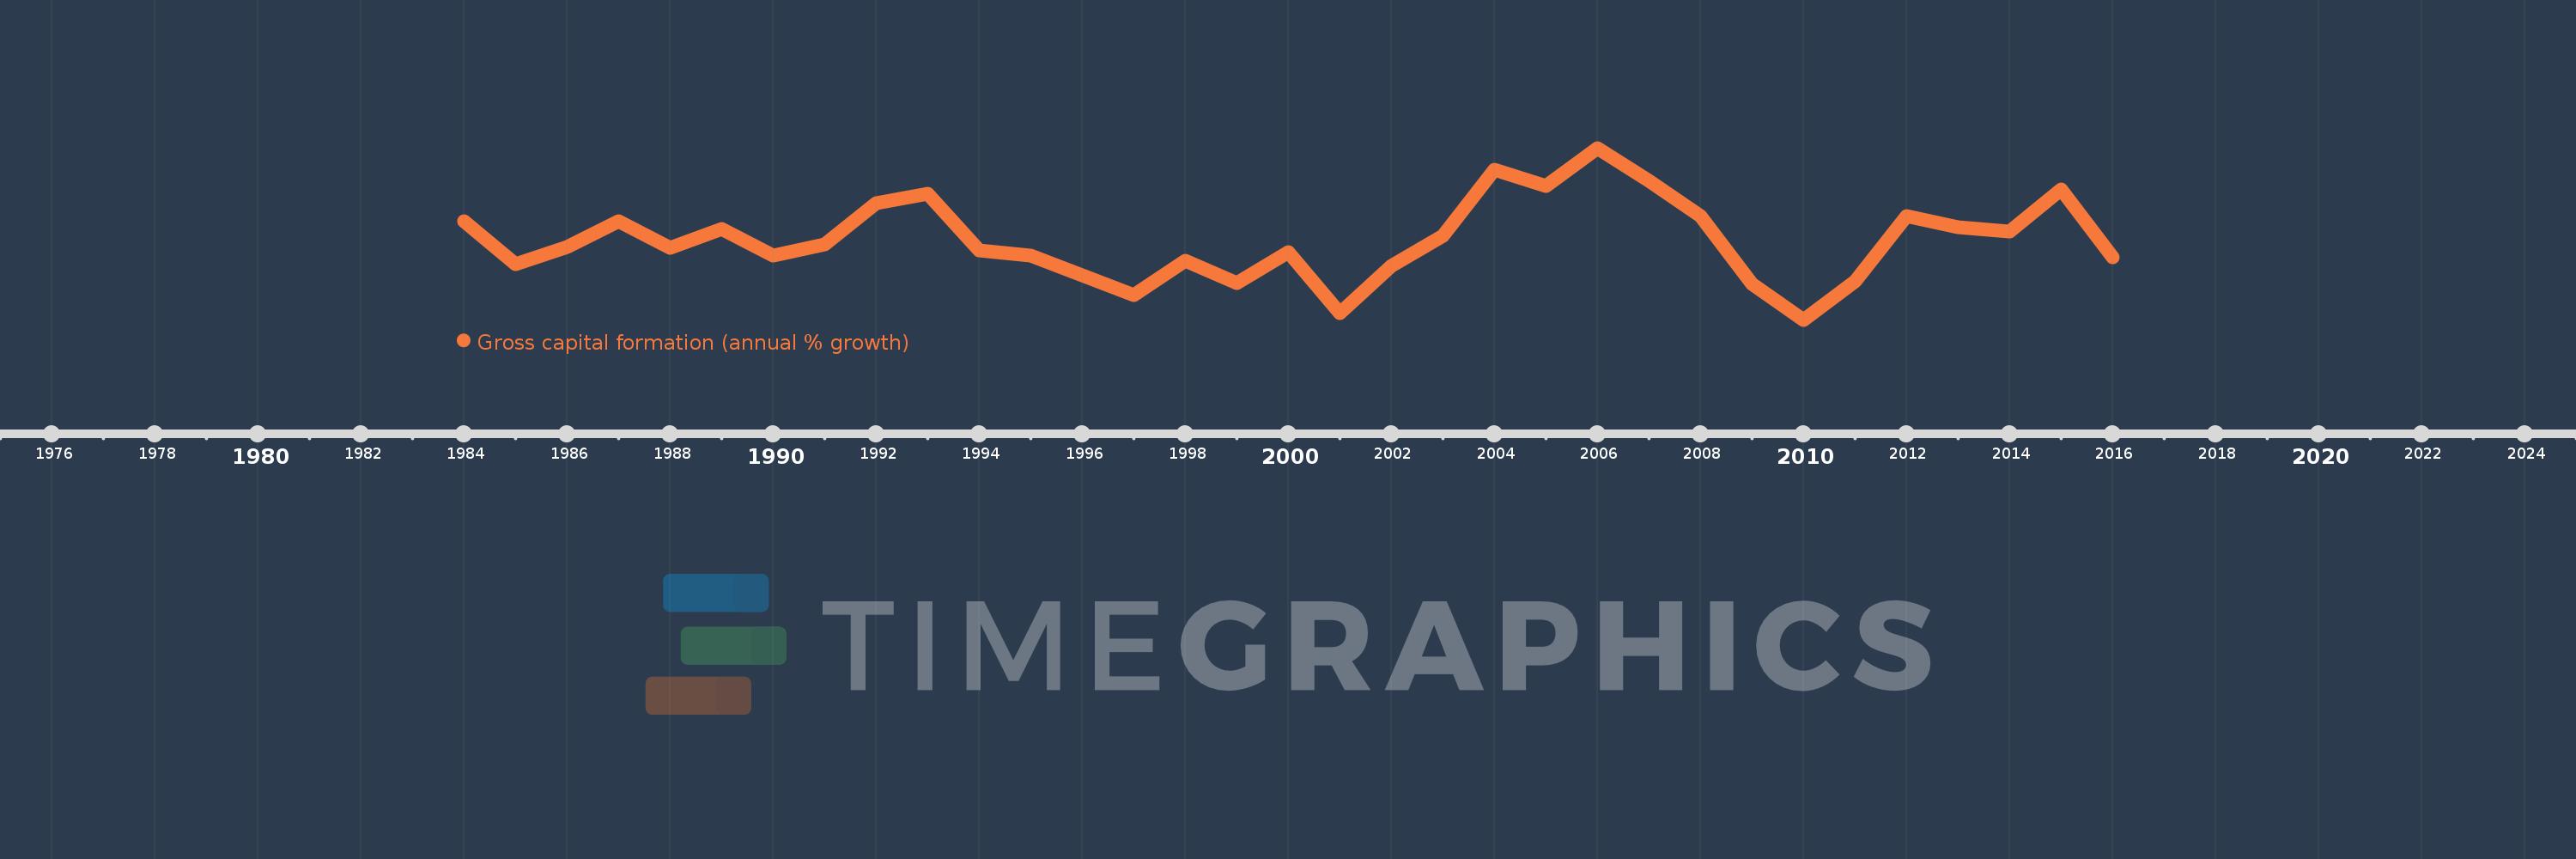
Gross capital formation (annual % growth)
2016,2015,2014,2013,2012,2011,2010,2009,2008,2007,2006,2005,2004,2003,2002,2001,2000,1999,1998,1997,1996,1995,1994,1993,1992,1991,1990,1989,1988,1987,1986,1985,1984
This statistics in other country:
AlbaniaAlgeriaAntigua and BarbudaArab WorldArgentinaArmeniaAustraliaAustriaAzerbaijanBahamas, TheBahrainBangladeshBarbadosBelarusBelgiumBelizeBeninBhutanBoliviaBosnia and HerzegovinaBotswanaBrazilBrunei DarussalamBulgariaBurkina FasoBurundiCabo VerdeCambodiaCameroonCanadaCaribbean small statesCentral Europe and the BalticsChadChileChinaColombiaComorosCongo, Dem. Rep.Congo, Rep.Costa RicaCote d'IvoireCroatiaCubaCyprusCzech RepublicDenmarkDjiboutiDominican RepublicEarly-demographic dividendEast Asia & PacificEast Asia & Pacific (excluding high income)East Asia & Pacific (IDA & IBRD countries)EcuadorEgypt, Arab Rep.El SalvadorEquatorial GuineaEritreaEstoniaEthiopiaEuro areaEurope & Central AsiaEurope & Central Asia (excluding high income)Europe & Central Asia (IDA & IBRD countries)European UnionFijiFinlandFranceGabonGambia, TheGeorgiaGermanyGhanaGreeceGuatemalaGuineaGuinea-BissauHaitiHeavily indebted poor countries (HIPC)High incomeHondurasHong Kong SAR, ChinaHungaryIBRD onlyIcelandIDA & IBRD totalIDA blendIDA onlyIDA totalIndiaIndonesiaIran, Islamic Rep.IrelandIsraelItalyJamaicaJapanJordanKazakhstanKenyaKorea, Rep.KosovoKuwaitKyrgyz RepublicLao PDRLate-demographic dividendLatin America & Caribbean Latin America & Caribbean (excluding high income)Latin America & the Caribbean (IDA & IBRD countries)LatviaLeast developed countries: UN classificationLebanonLiberiaLithuaniaLow & middle incomeLow incomeLower middle incomeLuxembourgMacao SAR, ChinaMacedonia, FYRMadagascarMalawiMalaysiaMaliMaltaMauritaniaMauritiusMexicoMiddle East & North AfricaMiddle East & North Africa (excluding high income)Middle East & North Africa (IDA & IBRD countries)Middle incomeMoldovaMongoliaMontenegroMoroccoMozambiqueNamibiaNepalNetherlandsNew ZealandNicaraguaNigerNigeriaNorth AmericaNorwayOECD membersOmanOther small statesPakistanPanamaPapua New GuineaParaguayPeruPhilippinesPolandPortugalPost-demographic dividendPre-demographic dividendPuerto RicoQatarRomaniaRussian FederationRwandaSaudi ArabiaSenegalSerbiaSeychellesSierra LeoneSingaporeSlovak RepublicSloveniaSmall statesSomaliaSouth AfricaSouth AsiaSouth Asia (IDA & IBRD)South SudanSpainSri LankaSub-Saharan Africa Sub-Saharan Africa (excluding high income)Sub-Saharan Africa (IDA & IBRD countries)SudanSurinameSwazilandSwedenSwitzerlandSyrian Arab RepublicTajikistanTanzaniaThailandTimor-LesteTogoTrinidad and TobagoTunisiaTurkeyTurkmenistanUgandaUkraineUnited Arab EmiratesUnited KingdomUnited StatesUpper middle incomeUruguayUzbekistanVanuatuVenezuela, RBVietnamWest Bank and GazaWorldZimbabwe Timeline:
This timeline shows a graph from 1984 to 2016 of Macao SAR, China. No data until 1983. Number of actual observations by date: 33.
Source name:
World Development Indicators
Source organization:
World Bank national accounts data, and OECD National Accounts data files.
Categories, topics:
Economy & Growth
Last updated:
apr 23, 2017
Indicators value changes by year
Minimum:
-33.494
jan 1, 2010
Maximum:
60.169
jan 1, 2006
At the date of observation
Value
Absolute change
Change from previous value
jan 1, 1984
20.197
+20.197
0.0%
jan 1, 1985
-3.391
-23.588
-116.79%
jan 1, 1986
6.213
+9.604
-283.23%
jan 1, 1987
20.041
+13.829
222.58%
jan 1, 1988
5.731
-14.311
-71.41%
jan 1, 1989
16.138
+10.408
181.62%
jan 1, 1990
1.704
-14.435
-89.44%
jan 1, 1991
7.653
+5.949
349.1%
jan 1, 1992
29.88
+22.228
290.46%
jan 1, 1993
35.112
+5.232
17.51%
jan 1, 1994
4.48
-30.632
-87.24%
jan 1, 1995
1.545
-2.936
-65.52%
jan 1, 1996
-9.182
-10.727
-694.43%
jan 1, 1997
-20.055
-10.873
118.41%
jan 1, 1998
-1.504
+18.551
-92.5%
jan 1, 1999
-13.689
-12.185
810.12%
jan 1, 2000
3.221
+16.91
-123.53%
jan 1, 2001
-30.096
-33.317
-1.03K%
jan 1, 2002
-4.32
+25.775
-85.64%
jan 1, 2003
12.029
+16.35
-378.43%
jan 1, 2004
48.179
+36.15
300.51%
jan 1, 2005
39.443
-8.736
-18.13%
jan 1, 2006
60.169
+20.726
52.55%
jan 1, 2007
42.245
-17.924
-29.79%
jan 1, 2008
22.999
-19.246
-45.56%
jan 1, 2009
-14.109
-37.108
-161.35%
jan 1, 2010
-33.494
-19.385
137.4%
jan 1, 2011
-12.607
+20.887
-62.36%
jan 1, 2012
22.974
+35.582
-282.23%
jan 1, 2013
16.719
-6.255
-27.23%
jan 1, 2014
14.518
-2.201
-13.17%
jan 1, 2015
37.318
+22.8
157.05%
jan 1, 2016
0.585
-36.733
-98.43%
Ranking of countries by current statistics by years


Comments: