29
/
en
AIzaSyAYiBZKx7MnpbEhh9jyipgxe19OcubqV5w
April 1, 2024
30713
Europe & Central Asia
ECS
false
2
1
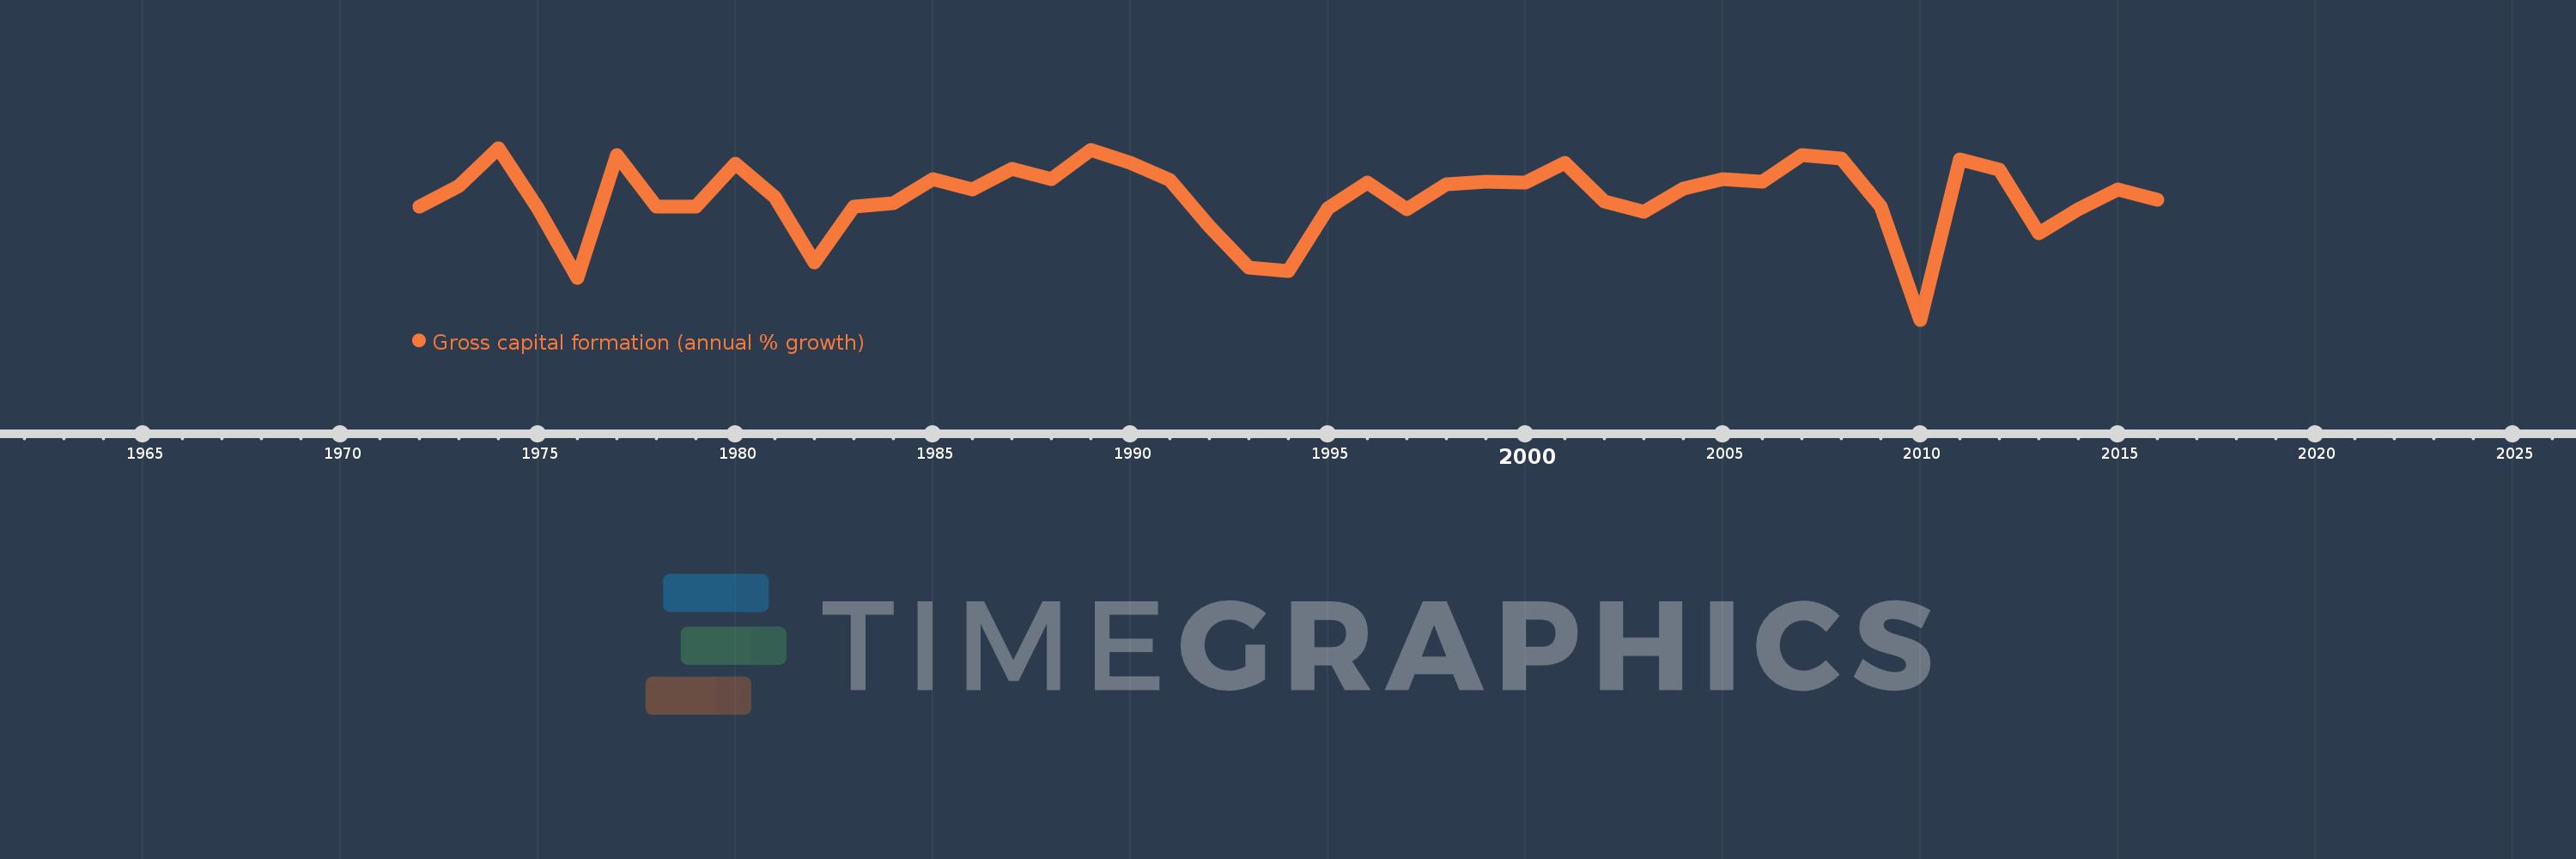
Gross capital formation (annual % growth)
2016,2015,2014,2013,2012,2011,2010,2009,2008,2007,2006,2005,2004,2003,2002,2001,2000,1999,1998,1997,1996,1995,1994,1993,1992,1991,1990,1989,1988,1987,1986,1985,1984,1983,1982,1981,1980,1979,1978,1977,1976,1975,1974,1973,1972
This statistics in other country:
AlbaniaAlgeriaAntigua and BarbudaArab WorldArgentinaArmeniaAustraliaAustriaAzerbaijanBahamas, TheBahrainBangladeshBarbadosBelarusBelgiumBelizeBeninBhutanBoliviaBosnia and HerzegovinaBotswanaBrazilBrunei DarussalamBulgariaBurkina FasoBurundiCabo VerdeCambodiaCameroonCanadaCaribbean small statesCentral Europe and the BalticsChadChileChinaColombiaComorosCongo, Dem. Rep.Congo, Rep.Costa RicaCote d'IvoireCroatiaCubaCyprusCzech RepublicDenmarkDjiboutiDominican RepublicEarly-demographic dividendEast Asia & PacificEast Asia & Pacific (excluding high income)East Asia & Pacific (IDA & IBRD countries)EcuadorEgypt, Arab Rep.El SalvadorEquatorial GuineaEritreaEstoniaEthiopiaEuro areaEurope & Central AsiaEurope & Central Asia (excluding high income)Europe & Central Asia (IDA & IBRD countries)European UnionFijiFinlandFranceGabonGambia, TheGeorgiaGermanyGhanaGreeceGuatemalaGuineaGuinea-BissauHaitiHeavily indebted poor countries (HIPC)High incomeHondurasHong Kong SAR, ChinaHungaryIBRD onlyIcelandIDA & IBRD totalIDA blendIDA onlyIDA totalIndiaIndonesiaIran, Islamic Rep.IrelandIsraelItalyJamaicaJapanJordanKazakhstanKenyaKorea, Rep.KosovoKuwaitKyrgyz RepublicLao PDRLate-demographic dividendLatin America & Caribbean Latin America & Caribbean (excluding high income)Latin America & the Caribbean (IDA & IBRD countries)LatviaLeast developed countries: UN classificationLebanonLiberiaLithuaniaLow & middle incomeLow incomeLower middle incomeLuxembourgMacao SAR, ChinaMacedonia, FYRMadagascarMalawiMalaysiaMaliMaltaMauritaniaMauritiusMexicoMiddle East & North AfricaMiddle East & North Africa (excluding high income)Middle East & North Africa (IDA & IBRD countries)Middle incomeMoldovaMongoliaMontenegroMoroccoMozambiqueNamibiaNepalNetherlandsNew ZealandNicaraguaNigerNigeriaNorth AmericaNorwayOECD membersOmanOther small statesPakistanPanamaPapua New GuineaParaguayPeruPhilippinesPolandPortugalPost-demographic dividendPre-demographic dividendPuerto RicoQatarRomaniaRussian FederationRwandaSaudi ArabiaSenegalSerbiaSeychellesSierra LeoneSingaporeSlovak RepublicSloveniaSmall statesSomaliaSouth AfricaSouth AsiaSouth Asia (IDA & IBRD)South SudanSpainSri LankaSub-Saharan Africa Sub-Saharan Africa (excluding high income)Sub-Saharan Africa (IDA & IBRD countries)SudanSurinameSwazilandSwedenSwitzerlandSyrian Arab RepublicTajikistanTanzaniaThailandTimor-LesteTogoTrinidad and TobagoTunisiaTurkeyTurkmenistanUgandaUkraineUnited Arab EmiratesUnited KingdomUnited StatesUpper middle incomeUruguayUzbekistanVanuatuVenezuela, RBVietnamWest Bank and GazaWorldZimbabwe Timeline:
This timeline shows a graph from 1972 to 2016 of Europe & Central Asia. No data until 1971. Number of actual observations by date: 45.
Source name:
World Development Indicators
Source organization:
World Bank national accounts data, and OECD National Accounts data files.
Categories, topics:
Economy & Growth
Last updated:
apr 23, 2017
Indicators value changes by year
Minimum:
-18.665
jan 1, 2010
At the date of observation
Value
Absolute change
Change from previous value
jan 1, 1972
-0.125
-0.125
0.0%
jan 1, 1973
3.181
+3.306
-2.64K%
jan 1, 1974
9.458
+6.277
197.31%
jan 1, 1975
-0.406
-9.864
-104.29%
jan 1, 1976
-11.82
-11.414
2.81K%
jan 1, 1977
8.236
+20.057
-169.68%
jan 1, 1978
-0.198
-8.435
-102.41%
jan 1, 1979
-0.192
+0.007
-3.28%
jan 1, 1980
6.912
+7.104
-3.7K%
jan 1, 1981
1.356
-5.556
-80.39%
jan 1, 1982
-9.286
-10.641
-784.9%
jan 1, 1983
-0.089
+9.197
-99.04%
jan 1, 1984
0.402
+0.491
-552.1%
jan 1, 1985
4.335
+3.933
977.31%
jan 1, 1986
2.7
-1.635
-37.72%
jan 1, 1987
5.997
+3.297
122.12%
jan 1, 1988
4.398
-1.599
-26.67%
jan 1, 1989
9.112
+4.714
107.19%
jan 1, 1990
7.084
-2.028
-22.26%
jan 1, 1991
4.208
-2.876
-40.6%
jan 1, 1992
-3.381
-7.589
-180.36%
jan 1, 1993
-10.153
-6.772
200.29%
jan 1, 1994
-10.709
-0.556
5.47%
jan 1, 1995
-0.415
+10.294
-96.12%
jan 1, 1996
3.726
+4.141
-997.09%
jan 1, 1997
-0.526
-4.252
-114.12%
jan 1, 1998
3.55
+4.076
-774.91%
jan 1, 1999
3.994
+0.444
12.5%
jan 1, 2000
3.767
-0.227
-5.68%
jan 1, 2001
7.084
+3.317
88.05%
jan 1, 2002
0.726
-6.358
-89.75%
jan 1, 2003
-0.969
-1.695
-233.4%
jan 1, 2004
2.855
+3.823
-394.73%
jan 1, 2005
4.37
+1.516
53.1%
jan 1, 2006
3.897
-0.474
-10.84%
jan 1, 2007
8.253
+4.356
111.8%
jan 1, 2008
7.694
-0.559
-6.78%
jan 1, 2009
-0.213
-7.907
-102.77%
jan 1, 2010
-18.665
-18.452
8.66K%
jan 1, 2011
7.594
+26.259
-140.68%
jan 1, 2012
5.944
-1.65
-21.73%
jan 1, 2013
-4.537
-10.481
-176.32%
jan 1, 2014
-0.544
+3.993
-88.01%
jan 1, 2015
2.664
+3.208
-589.77%
jan 1, 2016
0.966
-1.698
-63.75%
Ranking of countries by current statistics by years


Comments: