29
/
en
AIzaSyAYiBZKx7MnpbEhh9jyipgxe19OcubqV5w
April 1, 2024
127386
Equatorial Guinea
GNQ
true
2
1
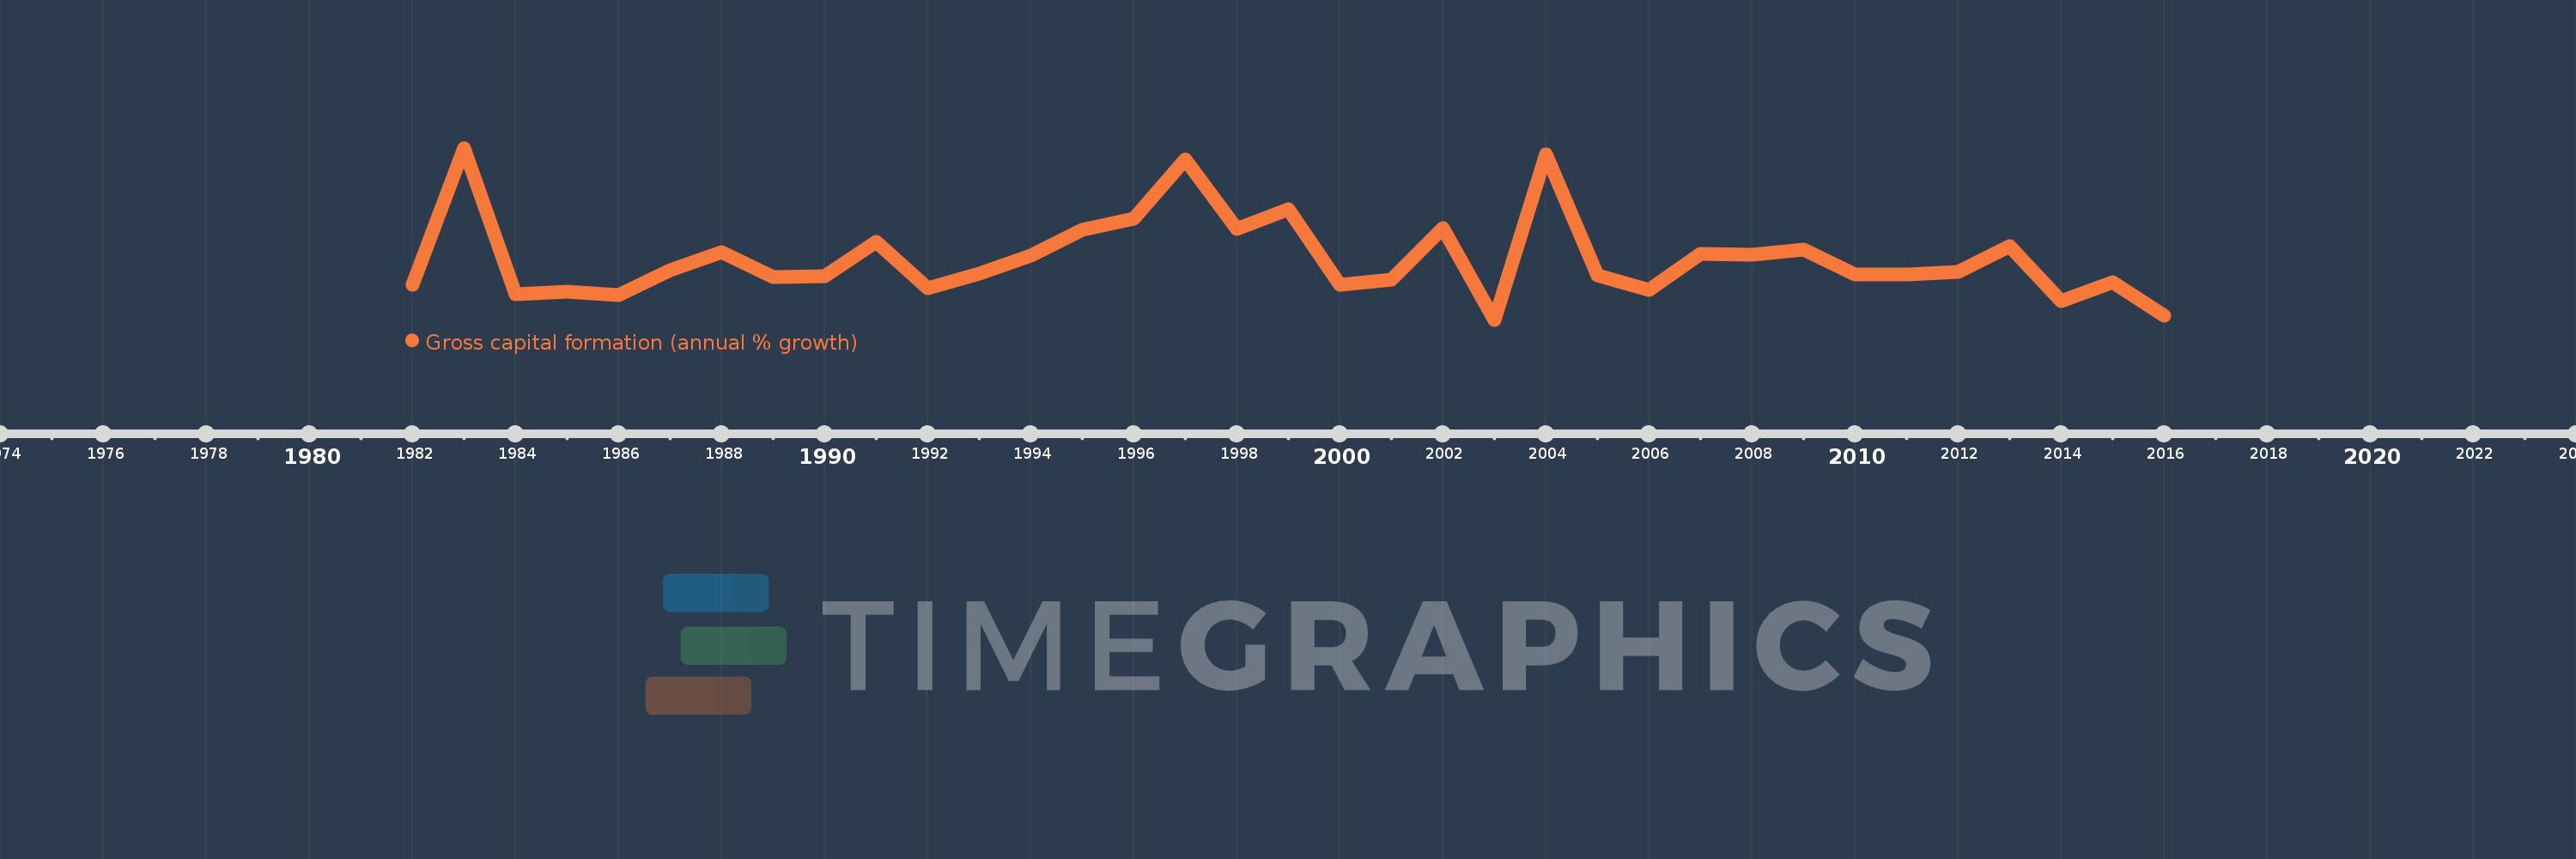
Gross capital formation (annual % growth)
2016,2015,2014,2013,2012,2011,2010,2009,2008,2007,2006,2005,2004,2003,2002,2001,2000,1999,1998,1997,1996,1995,1994,1993,1992,1991,1990,1989,1988,1987,1986,1985,1984,1983,1982
This statistics in other country:
AlbaniaAlgeriaAntigua and BarbudaArab WorldArgentinaArmeniaAustraliaAustriaAzerbaijanBahamas, TheBahrainBangladeshBarbadosBelarusBelgiumBelizeBeninBhutanBoliviaBosnia and HerzegovinaBotswanaBrazilBrunei DarussalamBulgariaBurkina FasoBurundiCabo VerdeCambodiaCameroonCanadaCaribbean small statesCentral Europe and the BalticsChadChileChinaColombiaComorosCongo, Dem. Rep.Congo, Rep.Costa RicaCote d'IvoireCroatiaCubaCyprusCzech RepublicDenmarkDjiboutiDominican RepublicEarly-demographic dividendEast Asia & PacificEast Asia & Pacific (excluding high income)East Asia & Pacific (IDA & IBRD countries)EcuadorEgypt, Arab Rep.El SalvadorEquatorial GuineaEritreaEstoniaEthiopiaEuro areaEurope & Central AsiaEurope & Central Asia (excluding high income)Europe & Central Asia (IDA & IBRD countries)European UnionFijiFinlandFranceGabonGambia, TheGeorgiaGermanyGhanaGreeceGuatemalaGuineaGuinea-BissauHaitiHeavily indebted poor countries (HIPC)High incomeHondurasHong Kong SAR, ChinaHungaryIBRD onlyIcelandIDA & IBRD totalIDA blendIDA onlyIDA totalIndiaIndonesiaIran, Islamic Rep.IrelandIsraelItalyJamaicaJapanJordanKazakhstanKenyaKorea, Rep.KosovoKuwaitKyrgyz RepublicLao PDRLate-demographic dividendLatin America & Caribbean Latin America & Caribbean (excluding high income)Latin America & the Caribbean (IDA & IBRD countries)LatviaLeast developed countries: UN classificationLebanonLiberiaLithuaniaLow & middle incomeLow incomeLower middle incomeLuxembourgMacao SAR, ChinaMacedonia, FYRMadagascarMalawiMalaysiaMaliMaltaMauritaniaMauritiusMexicoMiddle East & North AfricaMiddle East & North Africa (excluding high income)Middle East & North Africa (IDA & IBRD countries)Middle incomeMoldovaMongoliaMontenegroMoroccoMozambiqueNamibiaNepalNetherlandsNew ZealandNicaraguaNigerNigeriaNorth AmericaNorwayOECD membersOmanOther small statesPakistanPanamaPapua New GuineaParaguayPeruPhilippinesPolandPortugalPost-demographic dividendPre-demographic dividendPuerto RicoQatarRomaniaRussian FederationRwandaSaudi ArabiaSenegalSerbiaSeychellesSierra LeoneSingaporeSlovak RepublicSloveniaSmall statesSomaliaSouth AfricaSouth AsiaSouth Asia (IDA & IBRD)South SudanSpainSri LankaSub-Saharan Africa Sub-Saharan Africa (excluding high income)Sub-Saharan Africa (IDA & IBRD countries)SudanSurinameSwazilandSwedenSwitzerlandSyrian Arab RepublicTajikistanTanzaniaThailandTimor-LesteTogoTrinidad and TobagoTunisiaTurkeyTurkmenistanUgandaUkraineUnited Arab EmiratesUnited KingdomUnited StatesUpper middle incomeUruguayUzbekistanVanuatuVenezuela, RBVietnamWest Bank and GazaWorldZimbabwe Timeline:
This timeline shows a graph from 1982 to 2016 of Equatorial Guinea. No data until 1981. Number of actual observations by date: 35.
Source name:
World Development Indicators
Source organization:
World Bank national accounts data, and OECD National Accounts data files.
Categories, topics:
Economy & Growth
Last updated:
apr 23, 2017
Indicators value changes by year
Minimum:
-55.389
jan 1, 2003
Maximum:
159.962
jan 1, 1983
At the date of observation
Value
Absolute change
Change from previous value
jan 1, 1982
-11.916
-11.916
0.0%
jan 1, 1983
159.962
+171.879
-1.44K%
jan 1, 1984
-23.583
-183.546
-114.74%
jan 1, 1985
-20.168
+3.415
-14.48%
jan 1, 1986
-24.666
-4.498
22.3%
jan 1, 1987
6.609
+31.276
-126.8%
jan 1, 1988
28.869
+22.259
336.78%
jan 1, 1989
-2.097
-30.966
-107.27%
jan 1, 1990
-0.491
+1.607
-76.61%
jan 1, 1991
42.099
+42.589
-8.68K%
jan 1, 1992
-15.887
-57.985
-137.74%
jan 1, 1993
2.551
+18.438
-116.06%
jan 1, 1994
25.241
+22.689
889.27%
jan 1, 1995
57.529
+32.289
127.92%
jan 1, 1996
71.484
+13.955
24.26%
jan 1, 1997
145.344
+73.86
103.32%
jan 1, 1998
58.8
-86.544
-59.54%
jan 1, 1999
82.783
+23.983
40.79%
jan 1, 2000
-11.579
-94.362
-113.99%
jan 1, 2001
-5.098
+6.481
-55.97%
jan 1, 2002
59.731
+64.829
-1.27K%
jan 1, 2003
-55.389
-115.12
-192.73%
jan 1, 2004
152.574
+207.963
-375.46%
jan 1, 2005
0.503
-152.071
-99.67%
jan 1, 2006
-18.352
-18.855
-3.75K%
jan 1, 2007
26.703
+45.055
-245.51%
jan 1, 2008
26.562
-0.141
-0.53%
jan 1, 2009
32.178
+5.616
21.14%
jan 1, 2010
1.741
-30.437
-94.59%
jan 1, 2011
1.147
-0.594
-34.14%
jan 1, 2012
4.281
+3.134
273.39%
jan 1, 2013
36.389
+32.108
750.03%
jan 1, 2014
-31.916
-68.306
-187.71%
jan 1, 2015
-7.867
+24.049
-75.35%
jan 1, 2016
-50.634
-42.767
543.6%
Ranking of countries by current statistics by years


Comments: