29
/
en
AIzaSyAYiBZKx7MnpbEhh9jyipgxe19OcubqV5w
April 1, 2024
107291
Colombia
COL
true
2
1
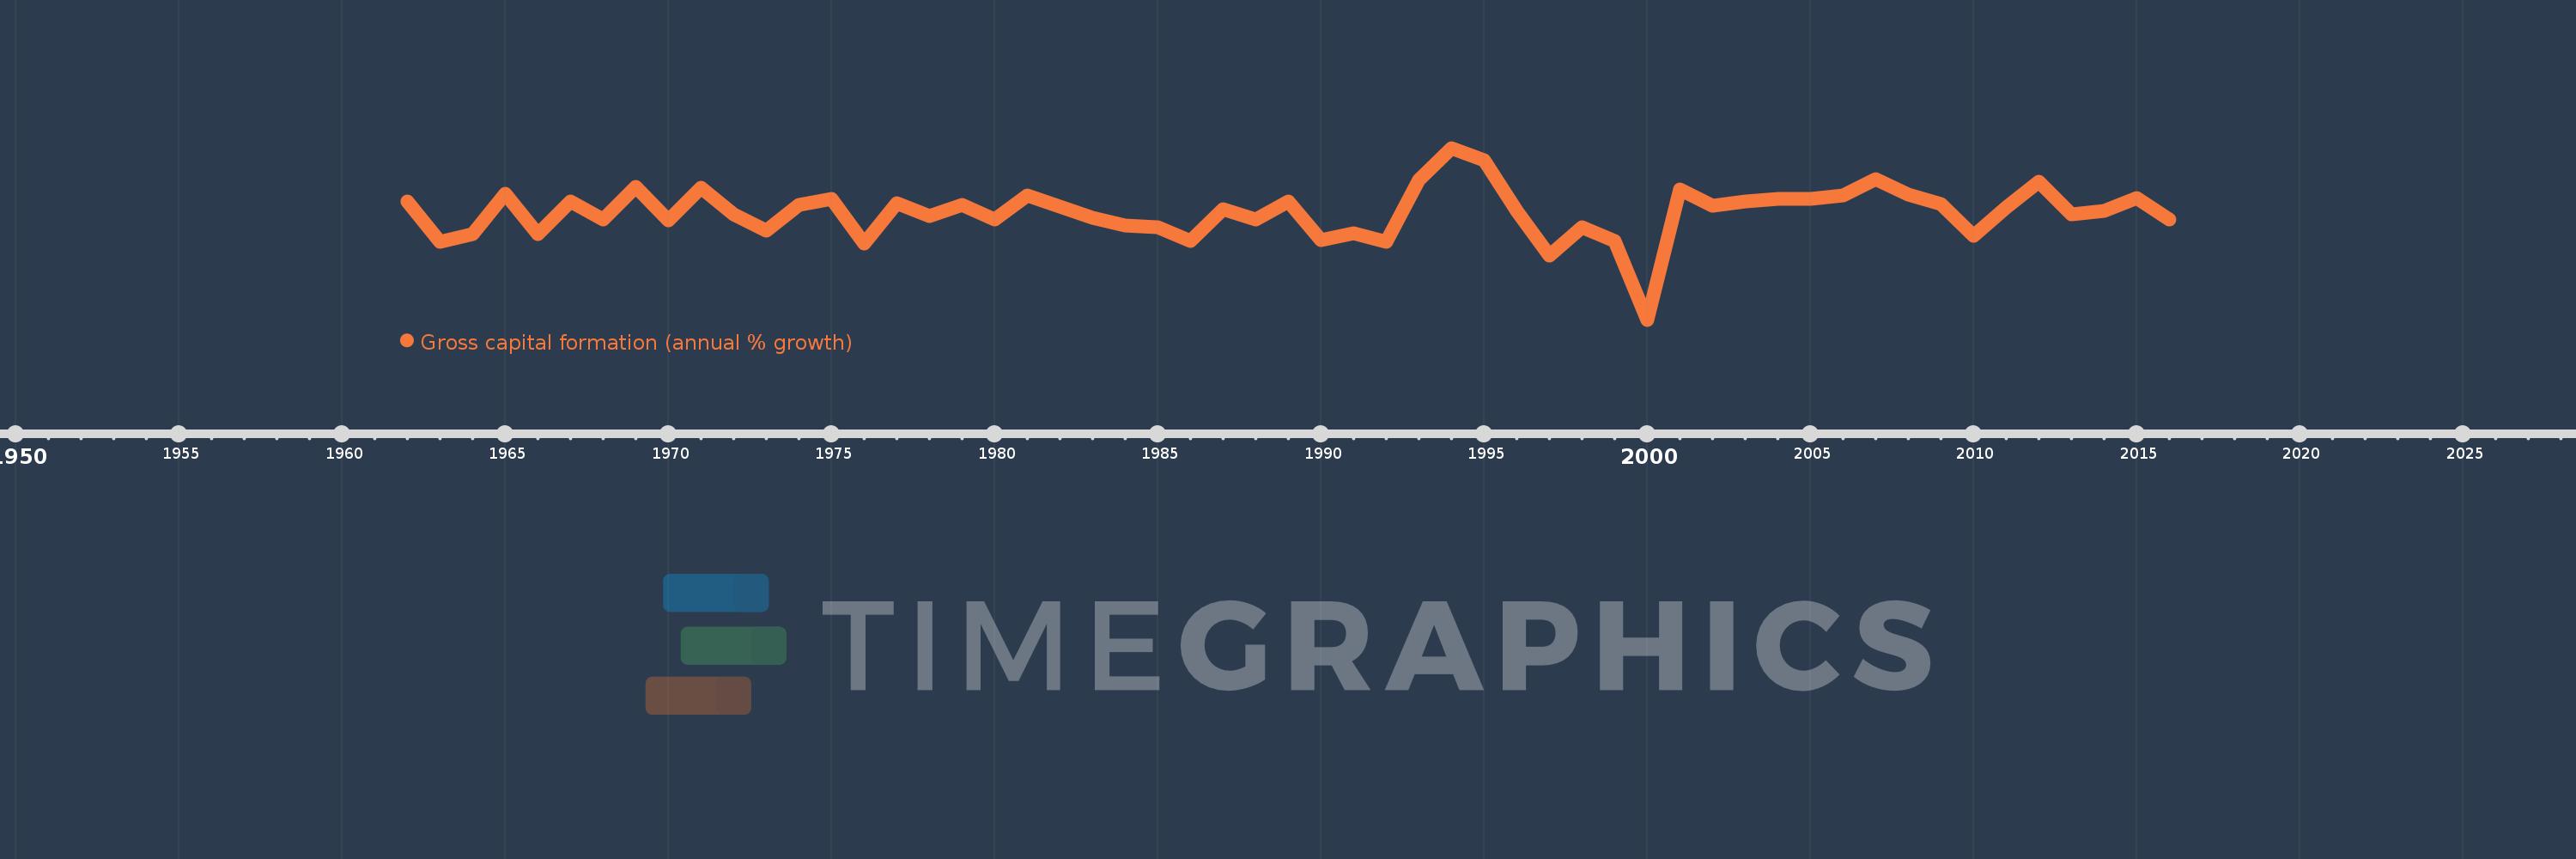
Gross capital formation (annual % growth)
2016,2015,2014,2013,2012,2011,2010,2009,2008,2007,2006,2005,2004,2003,2002,2001,2000,1999,1998,1997,1996,1995,1994,1993,1992,1991,1990,1989,1988,1987,1986,1985,1984,1983,1982,1981,1980,1979,1978,1977,1976,1975,1974,1973,1972,1971,1970,1969,1968,1967,1966,1965,1964,1963,1962
This statistics in other country:
AlbaniaAlgeriaAntigua and BarbudaArab WorldArgentinaArmeniaAustraliaAustriaAzerbaijanBahamas, TheBahrainBangladeshBarbadosBelarusBelgiumBelizeBeninBhutanBoliviaBosnia and HerzegovinaBotswanaBrazilBrunei DarussalamBulgariaBurkina FasoBurundiCabo VerdeCambodiaCameroonCanadaCaribbean small statesCentral Europe and the BalticsChadChileChinaColombiaComorosCongo, Dem. Rep.Congo, Rep.Costa RicaCote d'IvoireCroatiaCubaCyprusCzech RepublicDenmarkDjiboutiDominican RepublicEarly-demographic dividendEast Asia & PacificEast Asia & Pacific (excluding high income)East Asia & Pacific (IDA & IBRD countries)EcuadorEgypt, Arab Rep.El SalvadorEquatorial GuineaEritreaEstoniaEthiopiaEuro areaEurope & Central AsiaEurope & Central Asia (excluding high income)Europe & Central Asia (IDA & IBRD countries)European UnionFijiFinlandFranceGabonGambia, TheGeorgiaGermanyGhanaGreeceGuatemalaGuineaGuinea-BissauHaitiHeavily indebted poor countries (HIPC)High incomeHondurasHong Kong SAR, ChinaHungaryIBRD onlyIcelandIDA & IBRD totalIDA blendIDA onlyIDA totalIndiaIndonesiaIran, Islamic Rep.IrelandIsraelItalyJamaicaJapanJordanKazakhstanKenyaKorea, Rep.KosovoKuwaitKyrgyz RepublicLao PDRLate-demographic dividendLatin America & Caribbean Latin America & Caribbean (excluding high income)Latin America & the Caribbean (IDA & IBRD countries)LatviaLeast developed countries: UN classificationLebanonLiberiaLithuaniaLow & middle incomeLow incomeLower middle incomeLuxembourgMacao SAR, ChinaMacedonia, FYRMadagascarMalawiMalaysiaMaliMaltaMauritaniaMauritiusMexicoMiddle East & North AfricaMiddle East & North Africa (excluding high income)Middle East & North Africa (IDA & IBRD countries)Middle incomeMoldovaMongoliaMontenegroMoroccoMozambiqueNamibiaNepalNetherlandsNew ZealandNicaraguaNigerNigeriaNorth AmericaNorwayOECD membersOmanOther small statesPakistanPanamaPapua New GuineaParaguayPeruPhilippinesPolandPortugalPost-demographic dividendPre-demographic dividendPuerto RicoQatarRomaniaRussian FederationRwandaSaudi ArabiaSenegalSerbiaSeychellesSierra LeoneSingaporeSlovak RepublicSloveniaSmall statesSomaliaSouth AfricaSouth AsiaSouth Asia (IDA & IBRD)South SudanSpainSri LankaSub-Saharan Africa Sub-Saharan Africa (excluding high income)Sub-Saharan Africa (IDA & IBRD countries)SudanSurinameSwazilandSwedenSwitzerlandSyrian Arab RepublicTajikistanTanzaniaThailandTimor-LesteTogoTrinidad and TobagoTunisiaTurkeyTurkmenistanUgandaUkraineUnited Arab EmiratesUnited KingdomUnited StatesUpper middle incomeUruguayUzbekistanVanuatuVenezuela, RBVietnamWest Bank and GazaWorldZimbabwe Timeline:
This timeline shows a graph from 1962 to 2016 of Colombia. No data until 1961. Number of actual observations by date: 55.
Source name:
World Development Indicators
Source organization:
World Bank national accounts data, and OECD National Accounts data files.
Categories, topics:
Economy & Growth
Last updated:
apr 23, 2017
Indicators value changes by year
Minimum:
-38.666
jan 1, 2000
Maximum:
32.219
jan 1, 1994
At the date of observation
Value
Absolute change
Change from previous value
jan 1, 1962
10.085
+10.085
0.0%
jan 1, 1963
-6.676
-16.761
-166.2%
jan 1, 1964
-3.427
+3.249
-48.67%
jan 1, 1965
13.2
+16.626
-485.2%
jan 1, 1966
-3.192
-16.392
-124.19%
jan 1, 1967
10.183
+13.376
-418.99%
jan 1, 1968
2.568
-7.616
-74.78%
jan 1, 1969
16.04
+13.472
524.62%
jan 1, 1970
2.406
-13.633
-85.0%
jan 1, 1971
15.928
+13.521
561.86%
jan 1, 1972
4.783
-11.144
-69.97%
jan 1, 1973
-2.077
-6.86
-143.42%
jan 1, 1974
8.655
+10.732
-516.78%
jan 1, 1975
11.343
+2.688
31.06%
jan 1, 1976
-7.4
-18.743
-165.23%
jan 1, 1977
9.457
+16.857
-227.81%
jan 1, 1978
4.159
-5.298
-56.02%
jan 1, 1979
8.734
+4.576
110.02%
jan 1, 1980
2.863
-5.871
-67.22%
jan 1, 1981
12.58
+9.717
339.4%
jan 1, 1982
7.86
-4.721
-37.53%
jan 1, 1983
3.571
-4.289
-54.57%
jan 1, 1984
0.325
-3.246
-90.9%
jan 1, 1985
-0.372
-0.697
-214.54%
jan 1, 1986
-6.267
-5.894
1.58K%
jan 1, 1987
6.874
+13.14
-209.69%
jan 1, 1988
2.671
-4.202
-61.14%
jan 1, 1989
10.205
+7.534
282.04%
jan 1, 1990
-5.714
-15.919
-156.0%
jan 1, 1991
-2.902
+2.812
-49.21%
jan 1, 1992
-6.678
-3.776
130.12%
jan 1, 1993
19.026
+25.704
-384.89%
jan 1, 1994
32.219
+13.193
69.34%
jan 1, 1995
27.009
-5.21
-16.17%
jan 1, 1996
6.066
-20.943
-77.54%
jan 1, 1997
-12.02
-18.086
-298.16%
jan 1, 1998
-0.645
+11.375
-94.64%
jan 1, 1999
-6.308
-5.663
878.26%
jan 1, 2000
-38.666
-32.358
512.95%
jan 1, 2001
15.037
+53.702
-138.89%
jan 1, 2002
8.424
-6.613
-43.98%
jan 1, 2003
10.07
+1.646
19.54%
jan 1, 2004
11.355
+1.285
12.76%
jan 1, 2005
11.183
-0.172
-1.51%
jan 1, 2006
12.752
+1.568
14.02%
jan 1, 2007
19.188
+6.436
50.47%
jan 1, 2008
12.846
-6.342
-33.05%
jan 1, 2009
9.011
-3.835
-29.85%
jan 1, 2010
-3.929
-12.939
-143.6%
jan 1, 2011
7.701
+11.629
-296.01%
jan 1, 2012
18.467
+10.766
139.81%
jan 1, 2013
4.704
-13.763
-74.53%
jan 1, 2014
6.145
+1.44
30.62%
jan 1, 2015
11.54
+5.395
87.81%
jan 1, 2016
2.647
-8.893
-77.06%
Ranking of countries by current statistics by years


Comments: